CITY: WESTPORT, CT
BY: JUDY MICHAELIS, 203-247-5000
Westport Real Estate Market Update, Third Quarter 2022
Hi! I’m here with the Third Quarter Market Update, and the market is still super strong. We have 2.8 months supply of inventory, and that’s amazing because in 2019 we had 12.4 months supply of inventory, in 2020 we had 3 months of supply of inventory, and in 2021 we had 3, so we are at the lowest in inventory. Also quite interesting are our prices: our median sales price is $2,500,000; contrast that with $1,200,000 in 2019, $1,300,000 in 2020, and $1,600,000 in 2021. In addition, in the last 30 days we have had only 27 new homes come on the market, 32 accept an offer, and 31 close – so basically 27 came on the market, and 71 came off. So in Westport, CT, our market is pretty close to the highest it’s ever been. It’s definitely the highest sales price, and the activity is super strong & continued to stay that way.
If you found this interesting and fun, please subscribe below!
– Judy
Westport, CT Real Estate Market & Trends Overview
SEPTEMBER, 2022

Westport, CT Property Sales
SEPTEMBER, 2022
September Property sales were 37, down -19.6% from 46 in September of 2021 and -37.3% lower than the 59 sales last month. September 2022 sales were at their lowest level compared to September of 2021 and 2020. September YTD sales of 394 are running -20.4% behind last year’s year-to-date sales of 495.

Westport, CT Home Sale Prices
SEPTEMBER, 2022
The Median Sales Price in September was $1,925,000, up 36.3% from $1,412,500 in September of 2021 and up 5.0% from $1,832,500 last month. The Average Sales Price in September was $2,289,054, up 33.1% from $1,719,489 in September of 2021 and up 12.1% from $2,042,587 last month. September 2022 ASP was at highest level compared to September of 2021 and 2020.

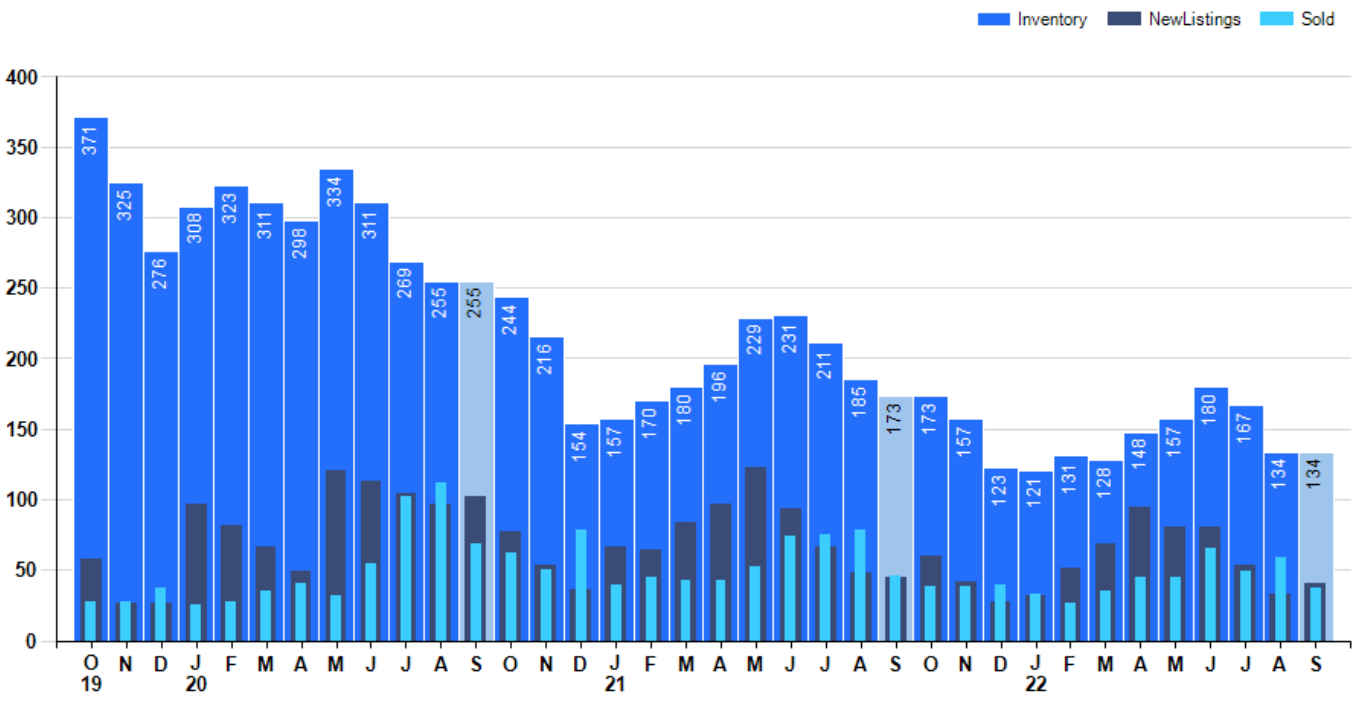
Westport, CT Inventory & MSI
SEPTEMBER, 2022
The Total Inventory of Properties available for sale as of September was 134, equal to 134 last month and down -22.5% from 173 in September of last year. September 2022 Inventory was at the lowest level compared to September of 2021 and 2020. A comparatively lower MSI is more beneficial for sellers while a higher MSI is better for buyers. The September 2022 MSI of 2.8 months was at its lowest level compared with September of 2021 and 2020.

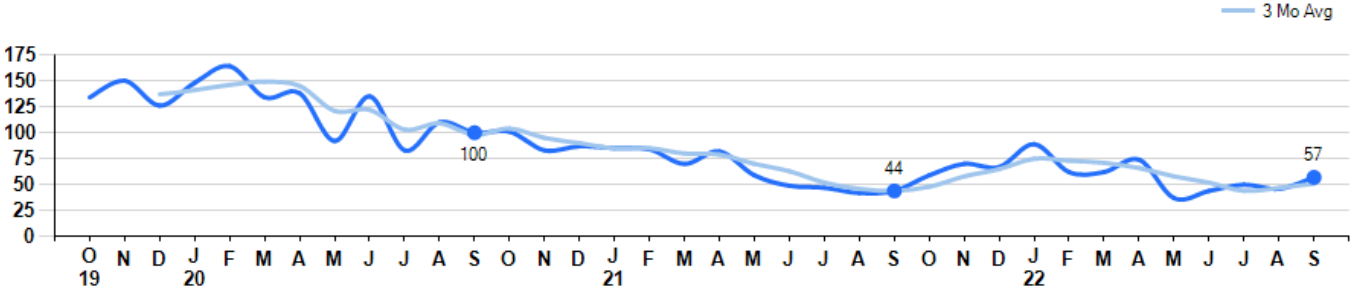
Westport, CT Market Time
SEPTEMBER, 2022
The average Days On Market (DOM) shows how many days the average Property is on the Market before it sells. An upward trend in DOM tends to indicate a move towards more of a Buyer’s market, a downward trend a move towards more of a Seller’s market. The DOM for September was 57, up 23.9% from 46 days last month and up 29.5% from 44 days in September of last year. The September 2022 DOM was at a mid range compared with September of 2021 and 2020.
Westport, CT Selling Price per Square Foot
SEPTEMBER, 2022
The Selling Price per Square Foot is a great indicator for the direction of Property values. Since Median Sales Price and Average Sales price can be impacted by the ‘mix’ of high or low end Properties in the market, the selling price per square foot is a more normalized indicator on the direction of Property values. The September 2022 Selling Price per Square Foot of $502 was up 3.9% from $483 last month and down -3.3% from $519 in September of last year.

Westport, CT Selling Price vs Listing Price
SEPTEMBER, 2022
The Selling Price vs Listing Price reveals the average amount that Sellers are agreeing to come down from their list price. The lower the ratio is below 100% the more of a Buyer’s market exists, a ratio at or above 100% indicates more of a Seller’s market. The September 2022 Selling Price vs List Price of 100.2% was up from 100.0% last month and up from 99.3% in September of last year.

Westport, CT Inventory / New Listings / Sales
SEPTEMBER, 2022
This last view of the market combines monthly inventory of Properties for sale along with New Listings and Sales. The graph shows the basic annual seasonality of the market as well as the relationship between these items. The number of New Listings in September 2022 was 41, up 24.2% from 33 last month and down -8.9% from 45 in September of last year.
Westport, CT Market Summary
SEPTEMBER, 2022

Current as of October 1, 2022. All data from SmartMLS. Report © 2022 ShowingTime.