CITY: WESTPORT, CT
BY: JUDY MICHAELIS, 203-247-5000
Westport Real Estate Market Update, October 2022
Hi Westport homeowners! I’m here with the October 2022 Market Update, and Westport continues to defy the national market. As you’ve read in the headlines nationally, the market is really correcting quite a bit. Here in Westport, we are not; we are correcting ever so slightly. In hindsight, the height of our market was probably February or March of 2022, but our numbers are slightly off. Compared to 2019, our average sales price is up $1,000,000. It is up to $2,300,000 from $1,300,000 in 2019. Our inventory is at 5.6 months supply of inventory versus 2019 up just above 13.4 months supply of inventory. So this may be the best time in years if you’ve been thinking of selling to sell and relocate to New York City, Florida, or any of the other national markets that are correcting quite a bit more than we are. Anyway, if you’ve had any thoughts of selling or you’d like to discuss your personal situation, I’d love to chat with you.
If you found this interesting and fun, please subscribe below!
– Judy
Westport, CT Real Estate Market & Trends Overview
OCTOBER, 2022

Westport, CT Property Sales
OCTOBER, 2022
October property sales were 24, down -36.8% from 38 in October of 2021 and -38.5% lower than the 39 sales last month. October 2022 sales were at their lowest level compared to October of 2021 and 2020. October YTD sales of 420 are running -21.2% behind last year’s year-to-date sales of 533.

Westport, CT Home Sale Prices
OCTOBER, 2022
The Median Sales Price in October was $1,503,438, up 17.0% from $1,285,000 in October of 2021 and down -21.9% from $1,925,000 last month. The Average Sales Price in October was $1,781,793, up 16.2% from $1,533,506 in October of 2021 and down -23.1% from $2,318,141 last month. October 2022 ASP was at highest level compared to October of 2021 and 2020.

Westport, CT Inventory & MSI
OCTOBER, 2022
The Total Inventory of Properties available for sale as of October was 129, down -11.6% from 146 last month and down -25.4% from 173 in October of last year. October 2022 Inventory was at the lowest level compared to October of 2021 and 2020. A comparatively lower MSI is more beneficial for sellers while a higher MSI is better for buyers. The October 2022 MSI of 5.4 months was at its highest level compared with October of 2021 and 2020.

Westport, CT Market Time
OCTOBER, 2022
The average Days On Market (DOM) shows how many days the average Property is on the Market before it sells. An upward trend in DOM tends to indicate a move towards more of a Buyer’s market, a downward trend a move towards more of a Seller’s market. The DOM for October was 55, down -11.3% from 62 days last month and down -6.8% from 59 days in October of last year. The October 2022 DOM was at its lowest level compared with October of 2021 and 2020.

Westport, CT Selling Price per Square Foot
OCTOBER, 2022
The Selling Price Per Square Foot is a great indicator for the direction of Property values. Since Median Sales Price and Average Sales Price can be impacted by the ‘mix’ of high or low end Properties in the market, the selling price per square foot is a more normalized indicator on the direction of property values. The October 2022 Selling Price per Square Foot of $526 was up 5.4% from $499 last month and up 19.3% from $441 in October of last year.

Westport, CT Selling Price vs Listing Price
OCTOBER, 2022
The Selling Price vs Listing Price reveals the average amount that Sellers are agreeing to come down from their list price. The lower the ratio is below 100% the more of a Buyer’s market exists, a ratio at or above 100% indicates more of a Seller’s market. The October 2022 Selling Price vs List Price of 99.3% was down from 99.4% last month and up from 98.0% in October of last year.

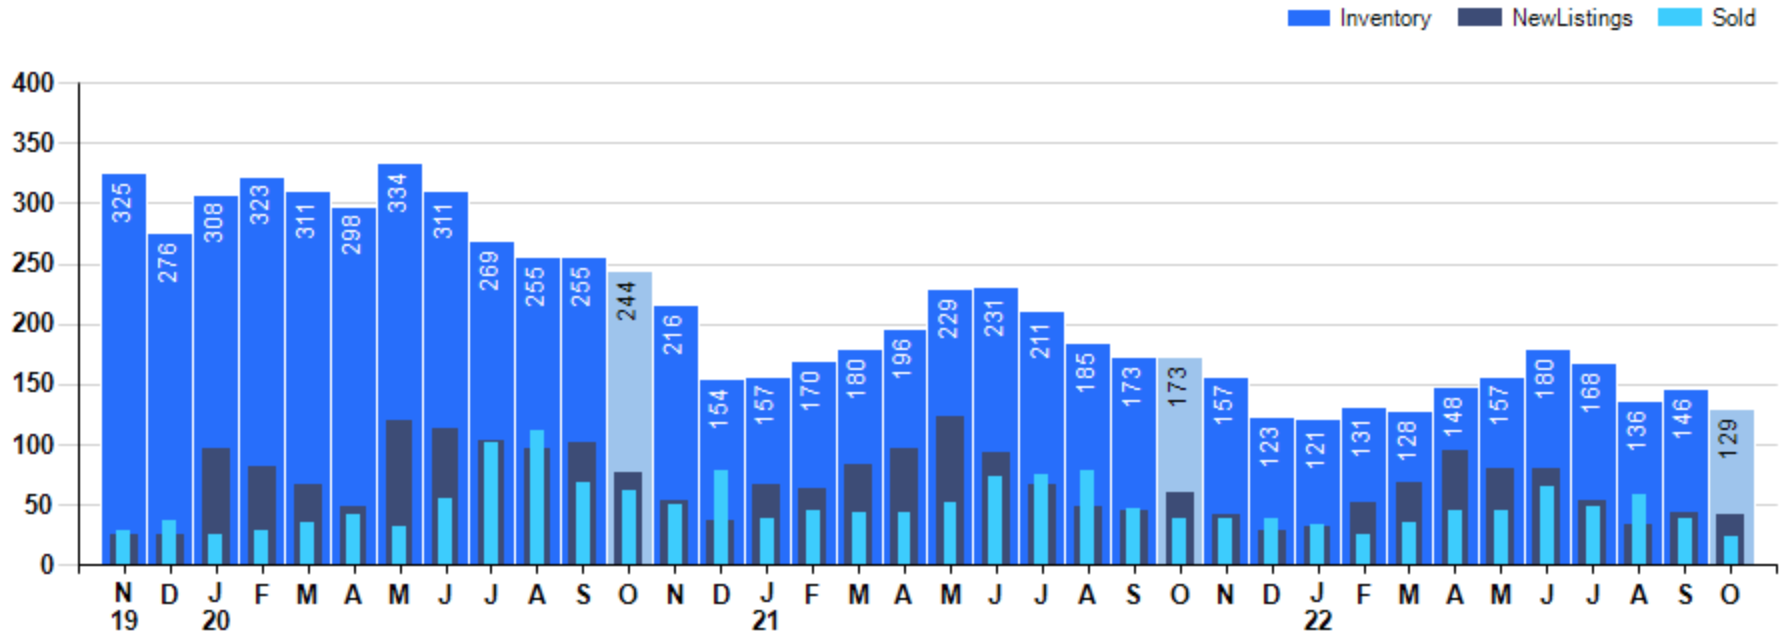
Westport, CT Inventory / New Listings / Sales
OCTOBER, 2022
This last view of the market combines monthly inventory of Properties for sale along with New Listings and Sales. The graph shows the basic annual seasonality of the market as well as the relationship between these items. The number of New Listings in October 2022 was 41, down -6.8% from 44 last month and down -31.7% from 60 in October of last year.
Westport, CT Market Summary
OCTOBER, 2022

©2022 Coldwell Banker. All Rights Reserved. Coldwell Banker and the Coldwell Banker logos are trademarks of Coldwell Banker Real Estate LLC. The Coldwell Banker® System is comprised of company owned offices which are owned by a subsidiary of Realogy Brokerage Group LLC and franchised offices which are independently owned and operated. The Coldwell Banker System fully supports the principles of the Fair Housing Act and the Equal Opportunity Act.

Based on information from SmartMLS for the period 1/1/2004 through 10/31/2022. Due to MLS reporting methods and allowable reporting policy, this data is only informational and may not be completely accurate. Therefore, Coldwell Banker Residential Brokerage does not guarantee the data accuracy. Data maintained by the MLS’s may not reflect all real estate activity in the market.