CITY: WESTPORT, CT
BY: JUDY MICHAELIS, 203-247-5000
Westport, CT Real Estate Market Update, November 2022
Hi Westport, CT homeowners! I’m here with the November 2022 Westport real estate market update. Our numbers are in and yes, everything continues to be the same. Our average sales price and our median sales price are 28% and 29% respectively. Our sales so far this year are down 22%, so it’d be nice to see how we close next year, but I think we’re going to close pretty much the way we are. I have been watching price reductions, and homes going pending: with the price reductions, nationally, 23% of homes in the last two weeks have taken a price reduction, while here in Westport of the 115 homes that we have active currently, only 5 have had a price reduction – so less than 5% are being reduced, versus nationally 23% so that gives you an idea of what’s going on in our local Westport housing market.
I’d love to chat with you if you want to know about what’s going on in your part of the market, and if you like what you see and hear, feel free to subscribe below!
– Judy
Westport, CT Real Estate Market & Trends Overview
NOVEMBER, 2022

Westport, CT Property Sales
NOVEMBER, 2022
November property sales were 24, down -36.8% from 38 in November of 2021 and -4.0% lower than the 25 sales last month. November 2022 sales were at their lowest level compared to November of 2021 and 2020. November YTD sales of 445 are running -22.1% behind last year’s year-to-date sales of 571.

Westport, CT Home Sale Prices
NOVEMBER, 2022
The Median Sales Price in November was $1,572,500, up 8.4% from $1,451,000 in November of 2021 and down -5.7% from $1,666,875 last month. The Average Sales Price in November was $1,882,500, up 17.6% from $1,600,842 in November of 2021 and down -4.9% from $1,978,521 last month. November 2022 ASP was at highest level compared to November of 2021 and 2020.

Westport, CT Inventory & MSI
NOVEMBER, 2022
The Total Inventory of Properties available for sale as of November was 127, down -11.8% from 144 last month and down -19.1% from 157 in November of last year. November 2022 Inventory was at the lowest level compared to November of 2021 and 2020. A comparatively lower MSI is more beneficial for sellers while a higher MSI is better for buyers. The November 2022 MSI of 5.3 months was at its highest level compared with November of 2021 and 2020.

Westport, CT Market Time
NOVEMBER, 2022
The average Days On Market (DOM) shows how many days the average Property is on the Market before it sells. An upward trend in DOM tends to indicate a move towards more of a Buyer’s market, a downward trend a move towards more of a Seller’s market. The DOM for November was 58, up 3.6% from 56 days last month and down -17.1% from 70 days in November of last year. The November 2022 DOM was at its lowest level compared with November of 2021 and 2020.

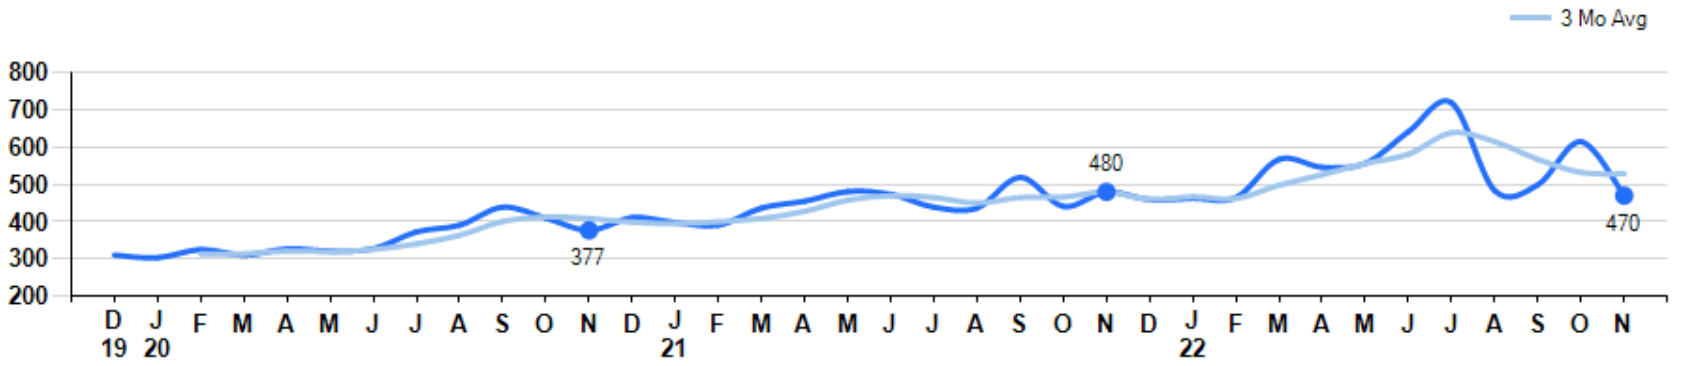
Westport, CT Selling Price per Square Foot
NOVEMBER, 2022
The Selling Price per Square Foot is a great indicator for the direction of Property values. Since Median Sales Price and Average Sales price can be impacted by the ‘mix’ of high or low end Properties in the market, the selling price per square foot is a more normalized indicator on the direction of Property values. The November 2022 Selling Price per Square Foot of $470 was down -23.5% from $614 last month and down -2.1% from $480 in November of last year.
Westport, CT Selling Price vs Listing Price
NOVEMBER, 2022
The Selling Price vs Listing Price reveals the average amount that Sellers are agreeing to come down from their list price. The lower the ratio is below 100% the more of a Buyer’s market exists, a ratio at or above 100% indicates more of a Seller’s market. The November 2022 Selling Price vs List Price of 93.9% was down from 99.4% last month and down from 99.8% in November of last year.

Westport, CT Inventory / New Listings / Sales
NOVEMBER, 2022
This last view of the market combines monthly inventory of Properties for sale along with New Listings and Sales. The graph shows the basic annual seasonality of the market as well as the relationship between these items. The number of New Listings in November 2022 was 33, down -26.7% from 45 last month and down -21.4% from 42 in November of last year.

Westport, CT Market Summary
NOVEMBER, 2022

©2022 Coldwell Banker. All Rights Reserved. Coldwell Banker and the Coldwell Banker logos are trademarks of Coldwell Banker Real Estate LLC. The Coldwell Banker® System is comprised of company owned offices which are owned by a subsidiary of Realogy Brokerage Group LLC and franchised offices which are independently owned and operated. The Coldwell Banker System fully supports the principles of the Fair Housing Act and the Equal Opportunity Act.

Based on information from SmartMLS for the period 1/1/2004 through 11/30/2022. Due to MLS reporting methods and allowable reporting policy, this data is only informational and may not be completely accurate. Therefore, Coldwell Banker Residential Brokerage does not guarantee the data accuracy. Data maintained by the MLS’s may not reflect all real estate activity in the market.