CITY: WESTPORT, CT
BY: JUDY MICHAELIS, 203-247-5000
Westport, CT Real Estate Market Update, May 2023
Hi Westport, CT homeowners! I’m here with the May 2023 Westport real estate market update. Our strong market continues, even while interest rates remain high – why is that? In the last 120 days, 43% of our sales have been 100% cash. Another factor that is affecting our market is low inventory. Our inventory has fallen 26% from last year, and that has probably risen because of the fact that our median sales price is up $600,000. Last year at the same time, it was $2,000,000 while now our median sales price is $2,600,000.
Sitting down with a top realtor is vital in helping you understand your options. If you’d like to know what’s going on in your part of Westport, or you’re looking for any further detailed analysis, feel free to call, text, or email me – I’d love to hear from you. If you like what you see and hear in my videos, just subscribe above!
– Judy
203-247-5000
judy@judymichaelis.com
Westport, CT Real Estate Market & Trends Overview
MAY, 2023

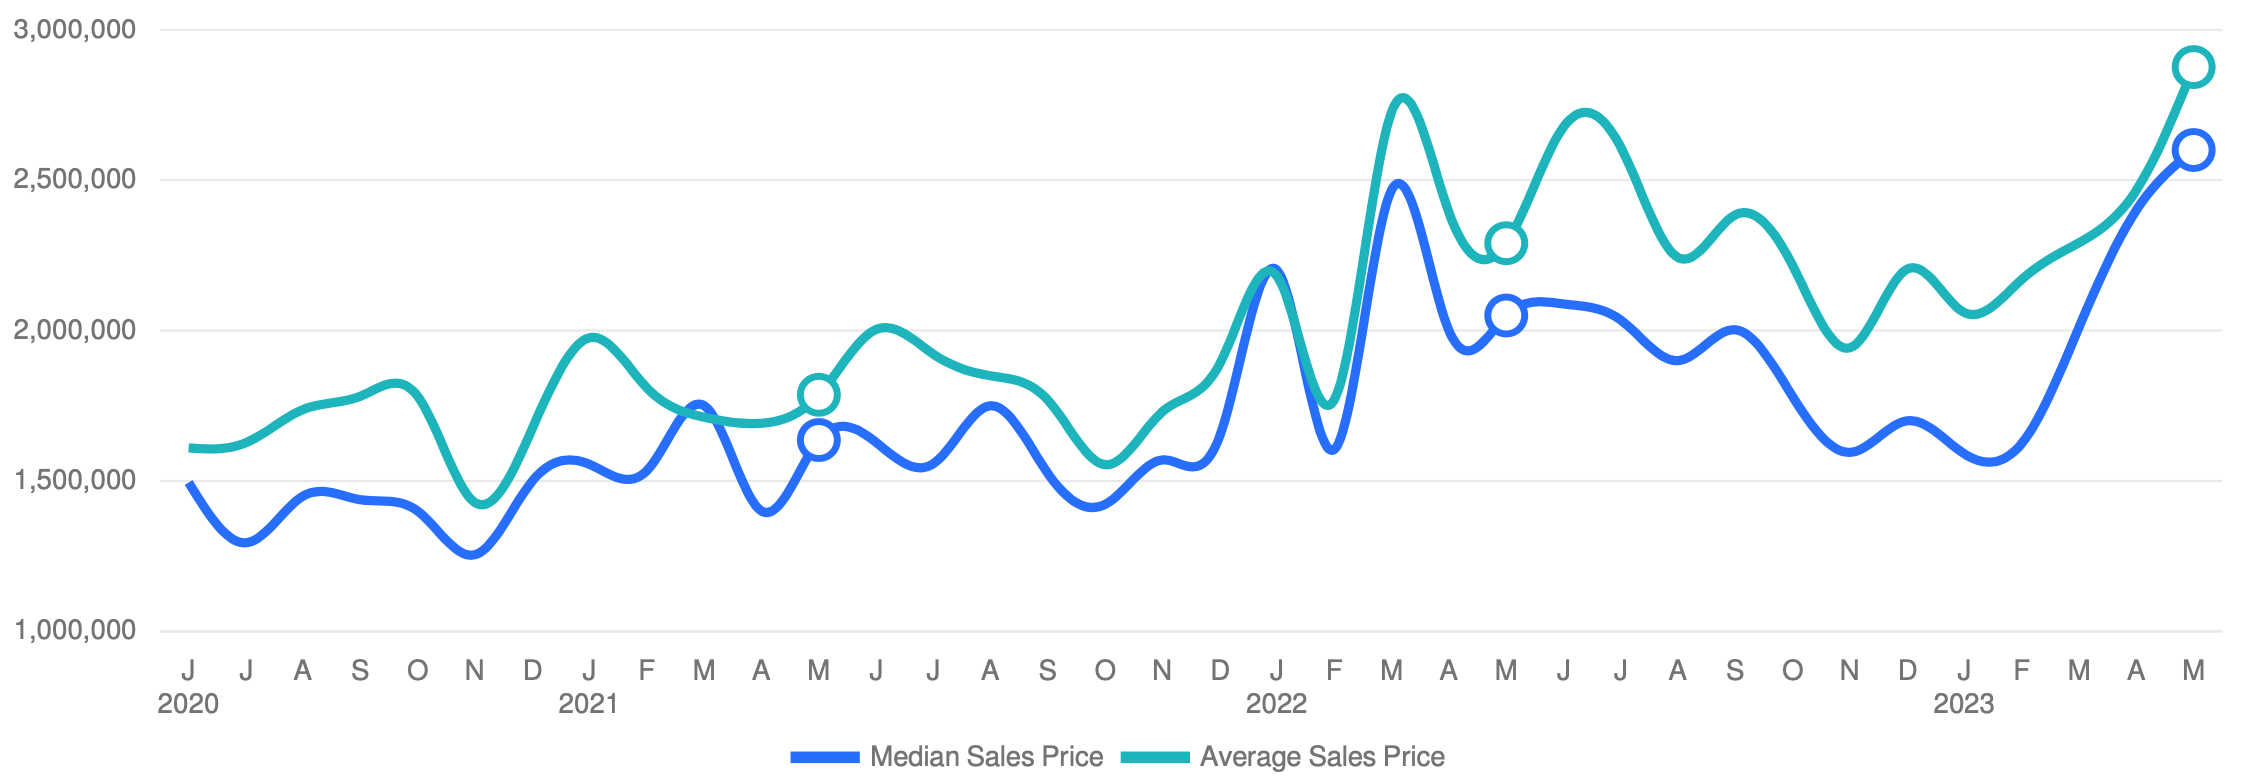
Westport, CT Average and Median Home Sales Prices
MAY, 2023
The median sales price in May 2023 was $2,600,000, up 8.33% from $2,400,000 from the previous month and 26.83% higher than $2,050,000 from May 2022. The May 2023 median sales price was at its highest level compared to May 2022 and 2021. The average sales price in May 2023 was $2,875,623, up 16.59% from $2,466,406 from the previous month and 25.56% higher than $2,290,303 from May 2022. The May 2023 average sale price was at its highest level compared to May 2022 and 2021.
Westport, CT Sales Price / List Price Ratio
MAY, 2023
The sales price/list price ratio is the average sale price divided by the average list price for sold properties expressed as a percentage. If it is above 100%, homes are selling for more than the list price. If it is less than 100%, homes are selling for less than the list price.The May 2023 sales price/list price ratio was 101.19%, up from 99.11% from the previous month and down from 109.09% from May 2022.

Westport, CT Number of Properties Sold and Absorption Rate
MAY, 2023
The number of properties sold in May 2023 was 25, up 56.25% from 16 from the previous month and -41.86% lower than 43 from May 2022. The May 2023 sales were at its lowest level compared to May 2022 and 2021. Absorption rate is the avg number of sales per month divided by the total number of available properties.

Westport, CT Average Days on Market (DOM)
MAY, 2023
The average days on market (DOM) is the number of days a property is on the market before it sells. An upward trend in DOM tends to indicate a move towards a buyer’s market, a downward trend tends to indicate a move towards seller’s market. The DOM for May 2023 was 88 days, up 54.39% from 57 days from the previous month and 125.64% higher than 39 days from May 2022. The May 2023 DOM was at its highest level compared with May 2022 and 2021.

Westport, CT Average Sales Price per Square Foot
MAY, 2023
The average sales price per square foot is a more normalized indicator for the direction of property value. Since Median Sales Price and Average Sales price can be impacted by the ‘mix’ of high or low end Properties in the real estate market, the selling price per square foot is a more normalized indicator for the direction of property value. The sales price per square foot in May 2023 was $561, up 7.68% from $521 from the previous month and equal to May 2022.

Westport, CT Inventory & MSI
MAY, 2023
The number of properties for sale in May 2023 was 87, down -17.92% from 106 from the previous month and -24.35% lower than 115 from May 2022. The May 2023 inventory was at its lowest level compared with May 2022 and 2021. A comparatively lower MSI is more beneficial for sellers while a higher MSI is better for buyers. The May 2023 MSI of 3.48 months was at a mid level compared with May 2022 and 2021.

Westport, CT New Listings
MAY, 2023
The number of new listings in May 2023 was 58, up 5.45% from 55 from the previous month and -21.62% lower than 74 from May 2022. The May 2023 listings were at its lowest level compared to May 2022 and 2021.

© 2023 Coldwell Banker. All Rights Reserved. Coldwell Banker and the Coldwell Banker logos are trademarks of Coldwell Banker Real Estate LLC. The Coldwell Banker® System is comprised of company owned offices which are owned by a subsidiary of Realogy Brokerage Group LLC and franchised offices which are independently owned and operated. The Coldwell Banker System fully supports the principles of the Fair Housing Act and the Equal Opportunity Act.

Based on information from SmartMLS for the period 6/1/2020 through 5/1/2023. Due to MLS reporting methods and allowable reporting policy, this data is only informational and may not be completely accurate. Therefore, Coldwell Banker Residential Brokerage does not guarantee the data accuracy. Data maintained by the MLS’s may not reflect all real estate activity in the market.