Westport, CT March 2024 Real Estate Market Update
CITY: WESTPORT, CT
BY: JUDY MICHAELIS, 203-247-5000
Westport homeowners,
Have a look at the numbers below, and let me know what you think!
Sitting down with a top realtor is vital in helping you understand your options. If you’d like to know what’s going on in your part of Westport, or you’re looking for any further detailed analysis, feel free to call, text, or email me – I’d love to have a personal conversation with you. If you like what you see and hear in my videos, just subscribe above!
– Judy
Westport, CT Real Estate Market & Trends Overview
MARCH, 2024
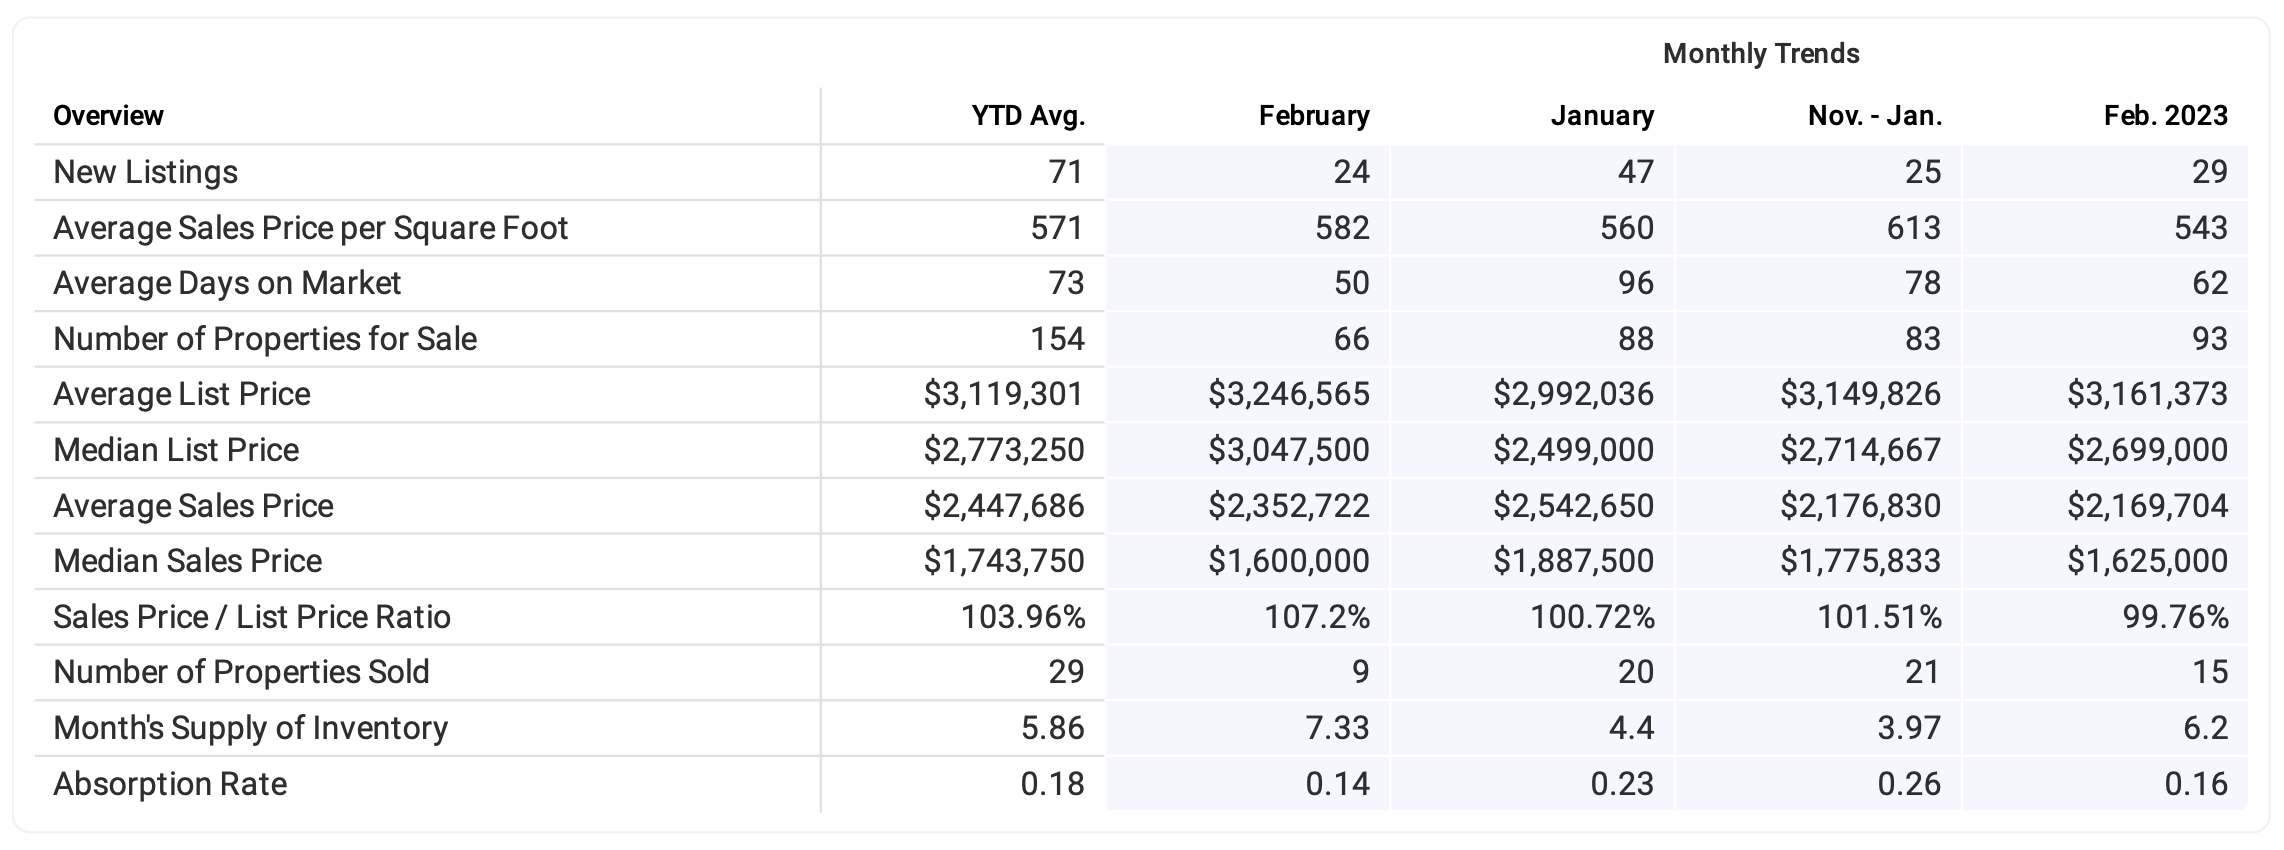
The overview below shows real estate activity from January 2024 to February 2024. You will see data comparisons between February and the previous month, the last three months and February 2023.
Westport, CT Average and Median Home Sales Prices
MARCH, 2024
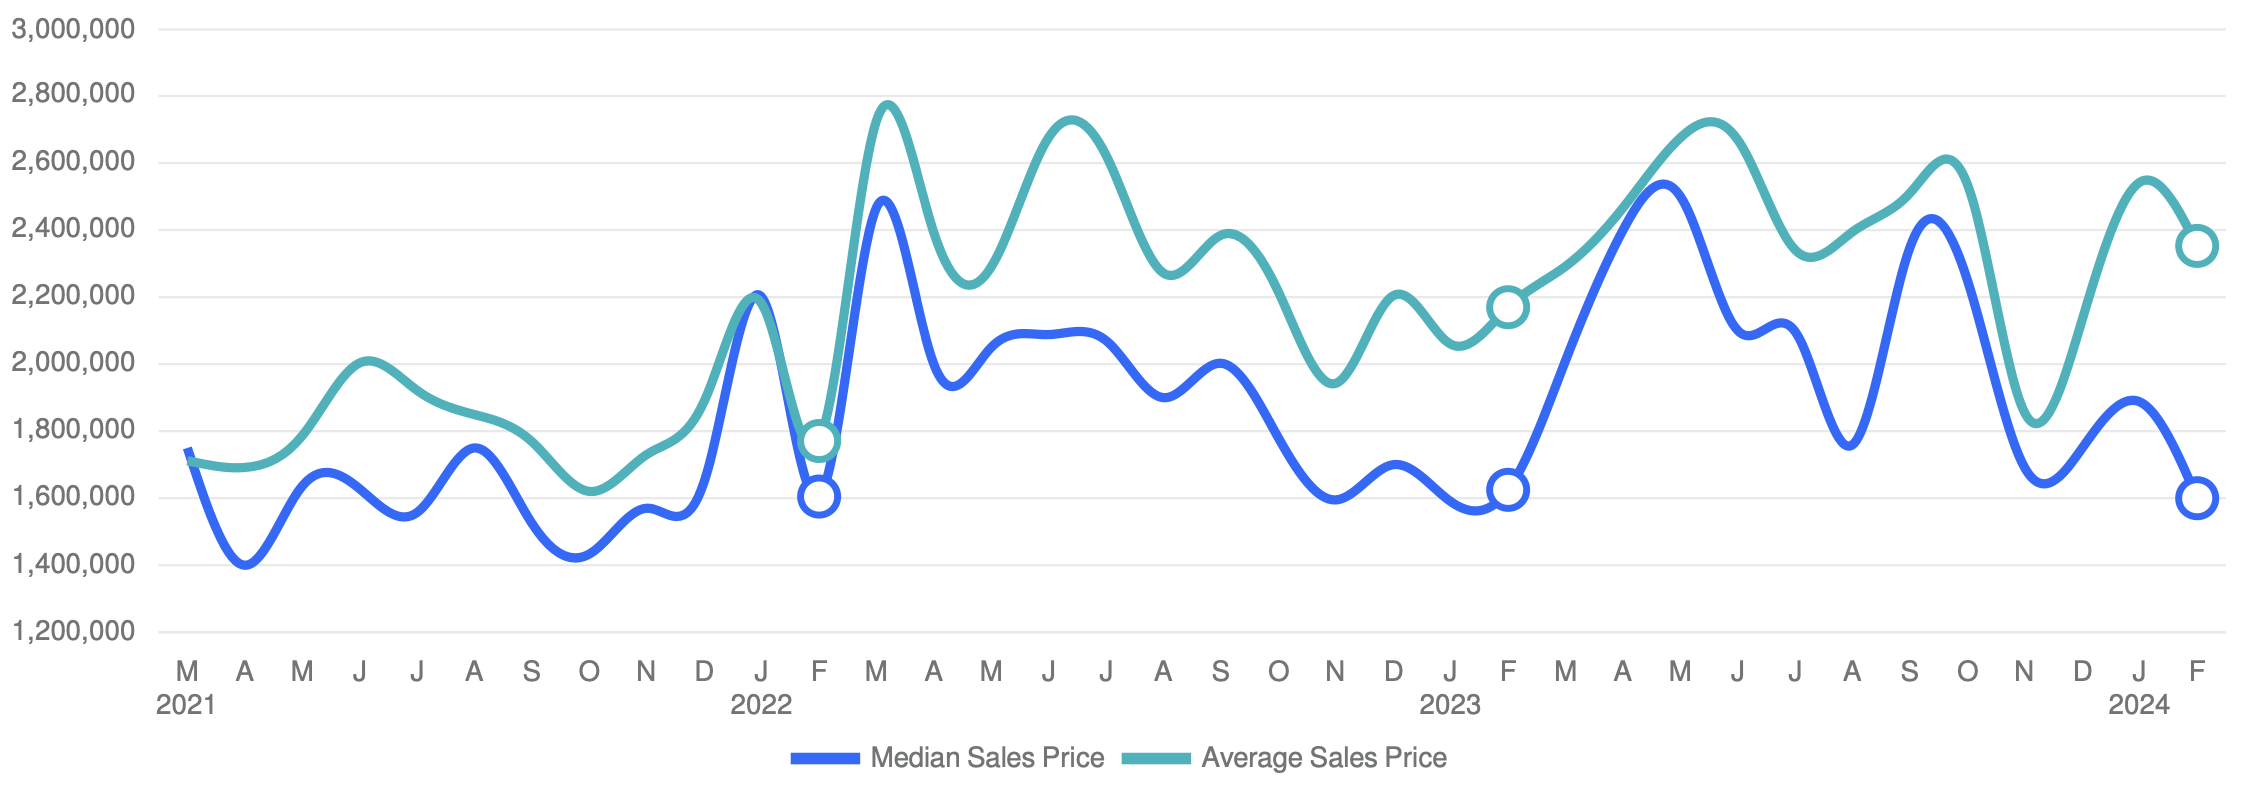
The median sales price in February 2024 was $1,600,000, down -15.23% from $1,887,500 from the previous month and -1.54% lower than $1,625,000 from February 2023. The February 2024 median sales price was at its lowest level compared to February 2023 and 2022. The average sales price in February 2024 was $2,352,722, down -7.47% from $2,542,650 from the previous month and 8.44% higher than $2,169,704 from February 2023. The February 2024 average sale price was at its highest level compared to February 2023 and 2022.
Westport, CT Sales Price / List Price Ratio
MARCH, 2024
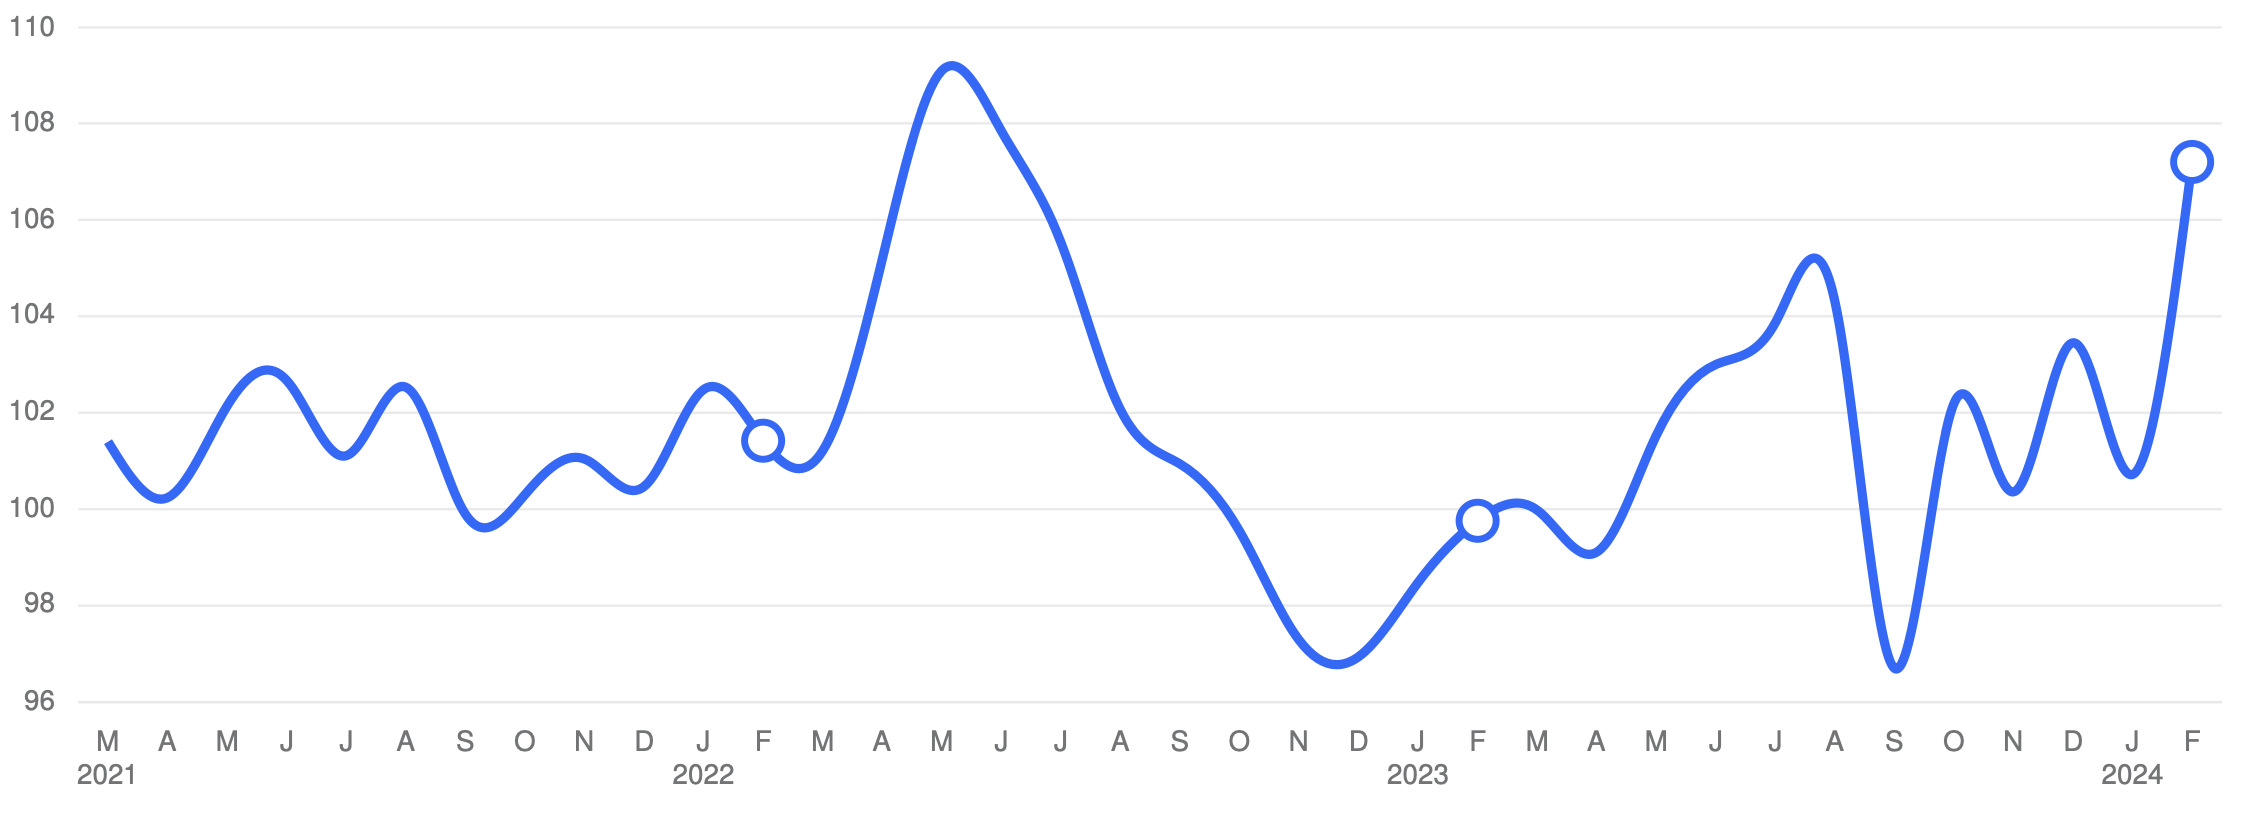
The sales price/list price ratio is the average sale price divided by the average list price for sold properties expressed as a percentage. If it is above 100%, homes are selling for more than the list price. If it is less than 100%, homes are selling for less than the list price. The February 2024 sales price/list price ratio was 107.2%, up from 100.72% from the previous month and up from 99.76% from February 2023.
Westport, CT Number of Properties Sold and Absorption Rate
MARCH, 2024
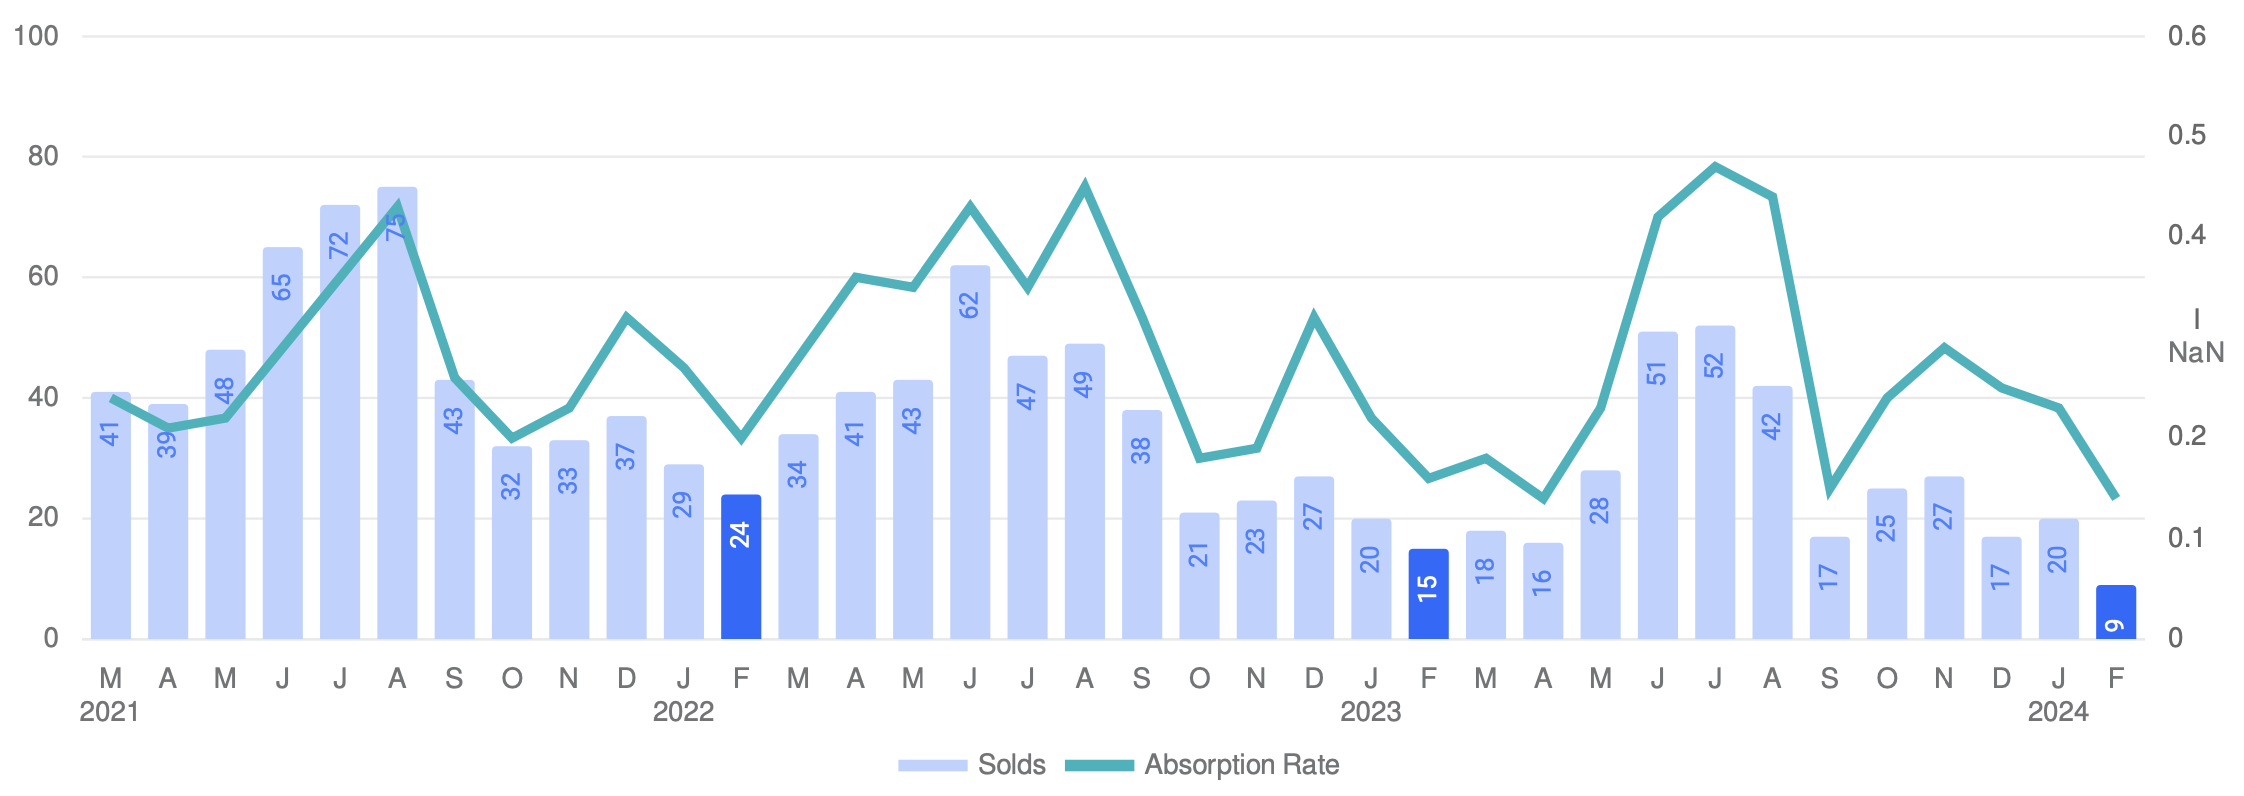
The number of properties sold in February 2024 was 9, down -55.00% from 20 from the previous month and -40.0% lower than 15 from February 2023. The February 2024 sales were at its lowest level compared to February 2023 and 2022. Absorption rate is the average number of sales per month divided by the total number of available properties.
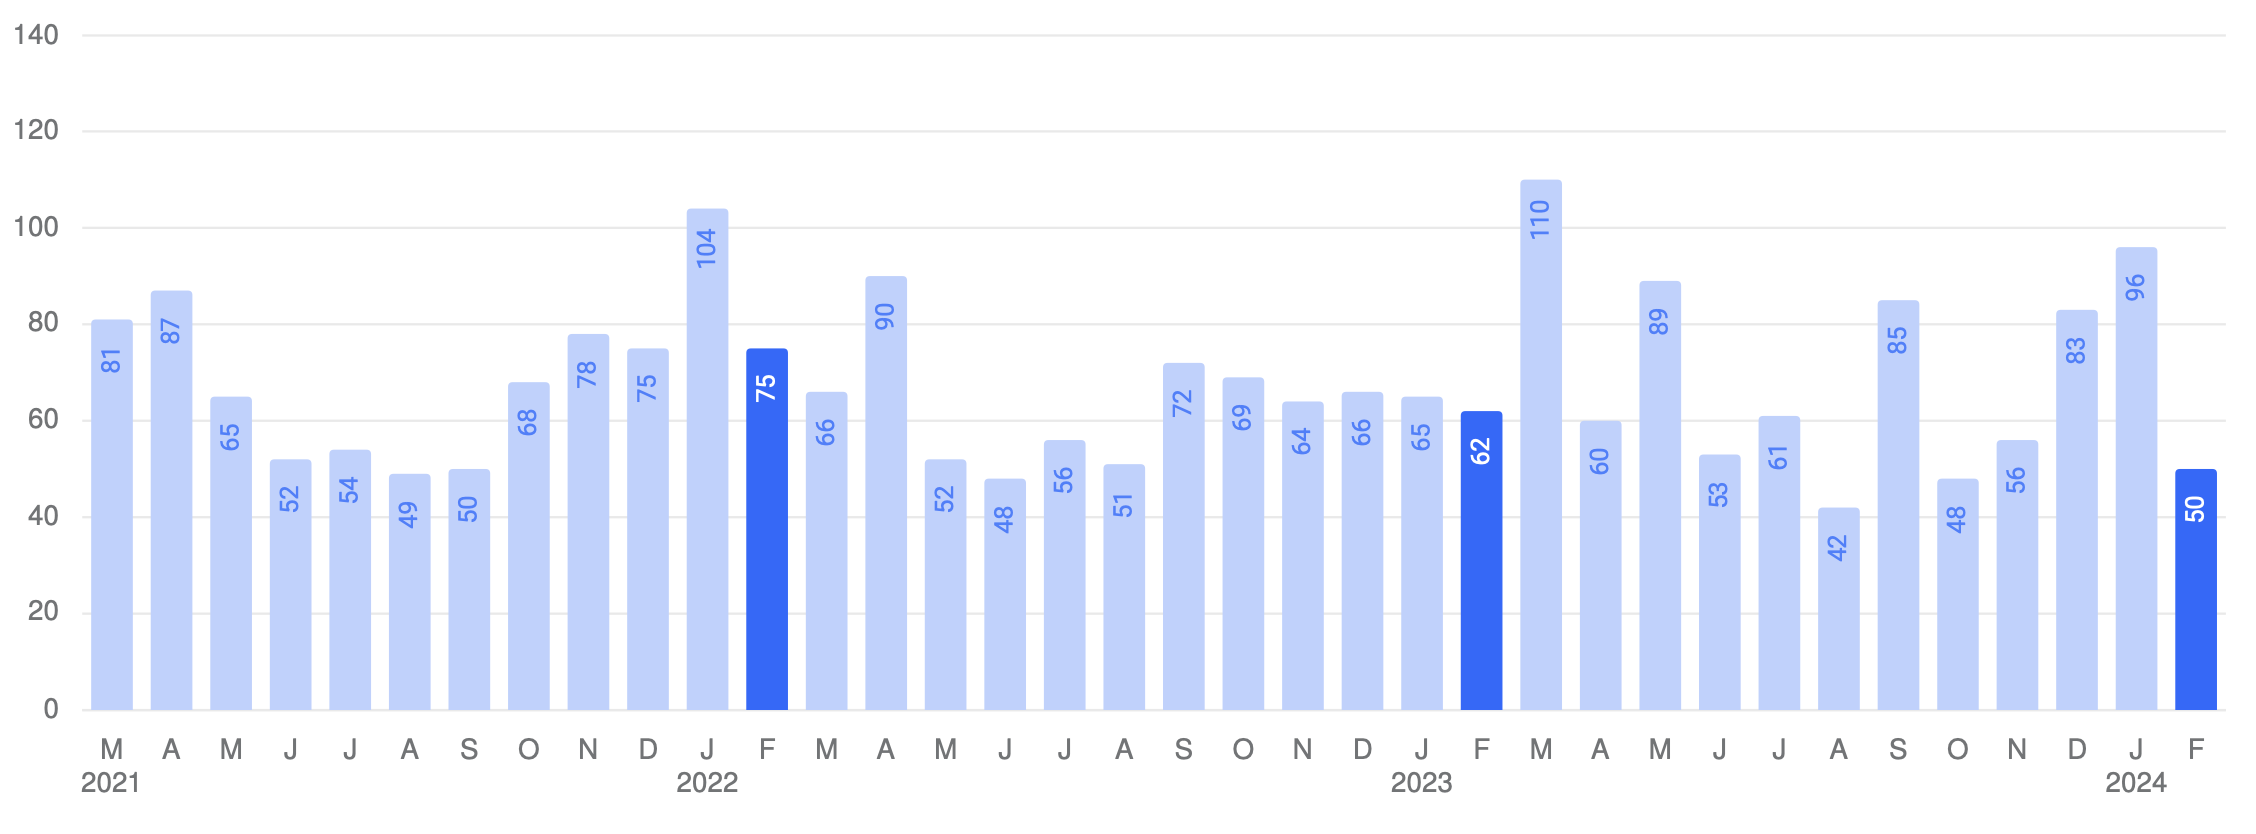
Westport, CT Average Days on Market (DOM)
MARCH, 2024
The average days on market (DOM) is the number of days a property is on the market before it sells. An upward trend in DOM tends to indicate a move towards a buyer’s market, a downward trend tends to indicate a move towards seller’s market. The DOM for February 2024 was 50 days, down -47.92% from 96 days from the previous month and -19.35% lower than 62 days from February 2023. The February 2024 DOM was at its lowest level compared with February 2023 and 2022.
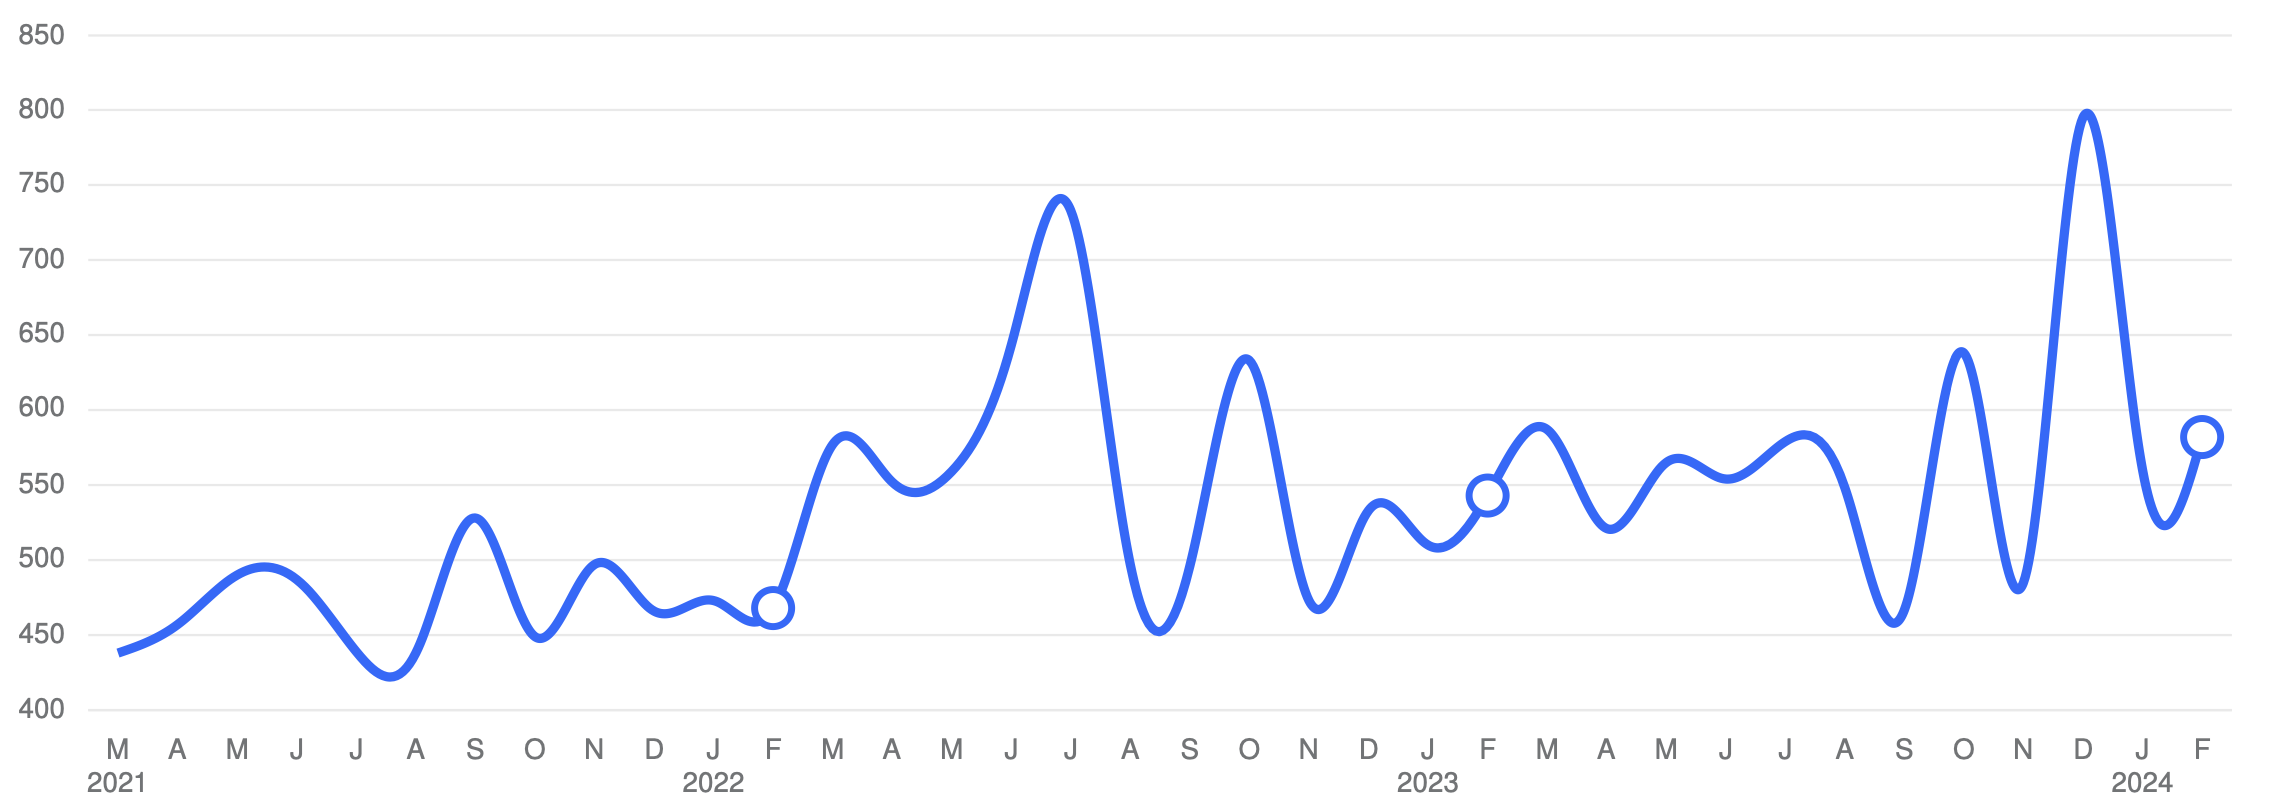
Westport, CT Average Sales Price per Square Foot
MARCH, 2024
The average sales price per square foot is a more normalized indicator for the direction of property value. The sales price per square foot in February 2024 was $582, up 3.93% from $560 from the previous month and 7.18% higher than $543 from February 2023.
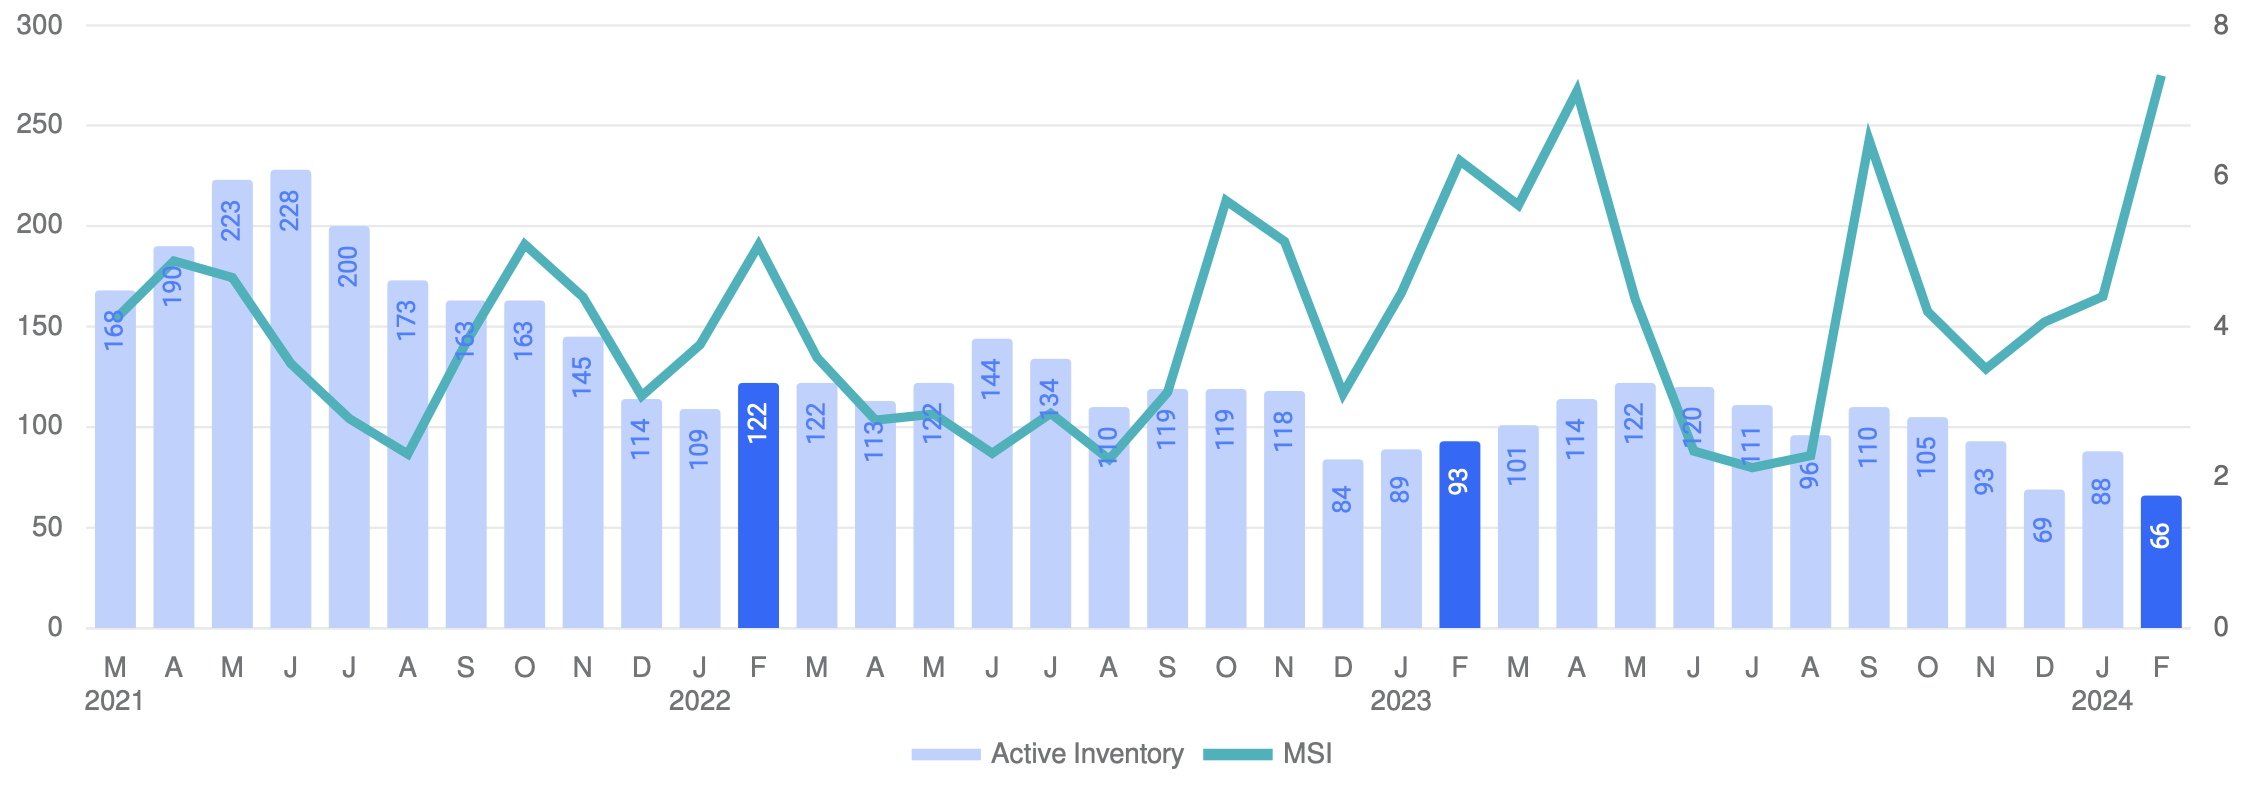
Westport, CT Inventory & MSI
MARCH, 2024
The number of properties for sale in February 2024 was 66, down -25.00% from 88 from the previous month and -29.03% lower than 93 from February 2023. The February 2024 inventory was at its lowest level compared with February 2023 and 2022. A comparatively lower MSI is more beneficial for sellers while a higher MSI is better for buyers. The February 2024 MSI of 7.33 months was at its highest level compared with February 2023 and 2022.
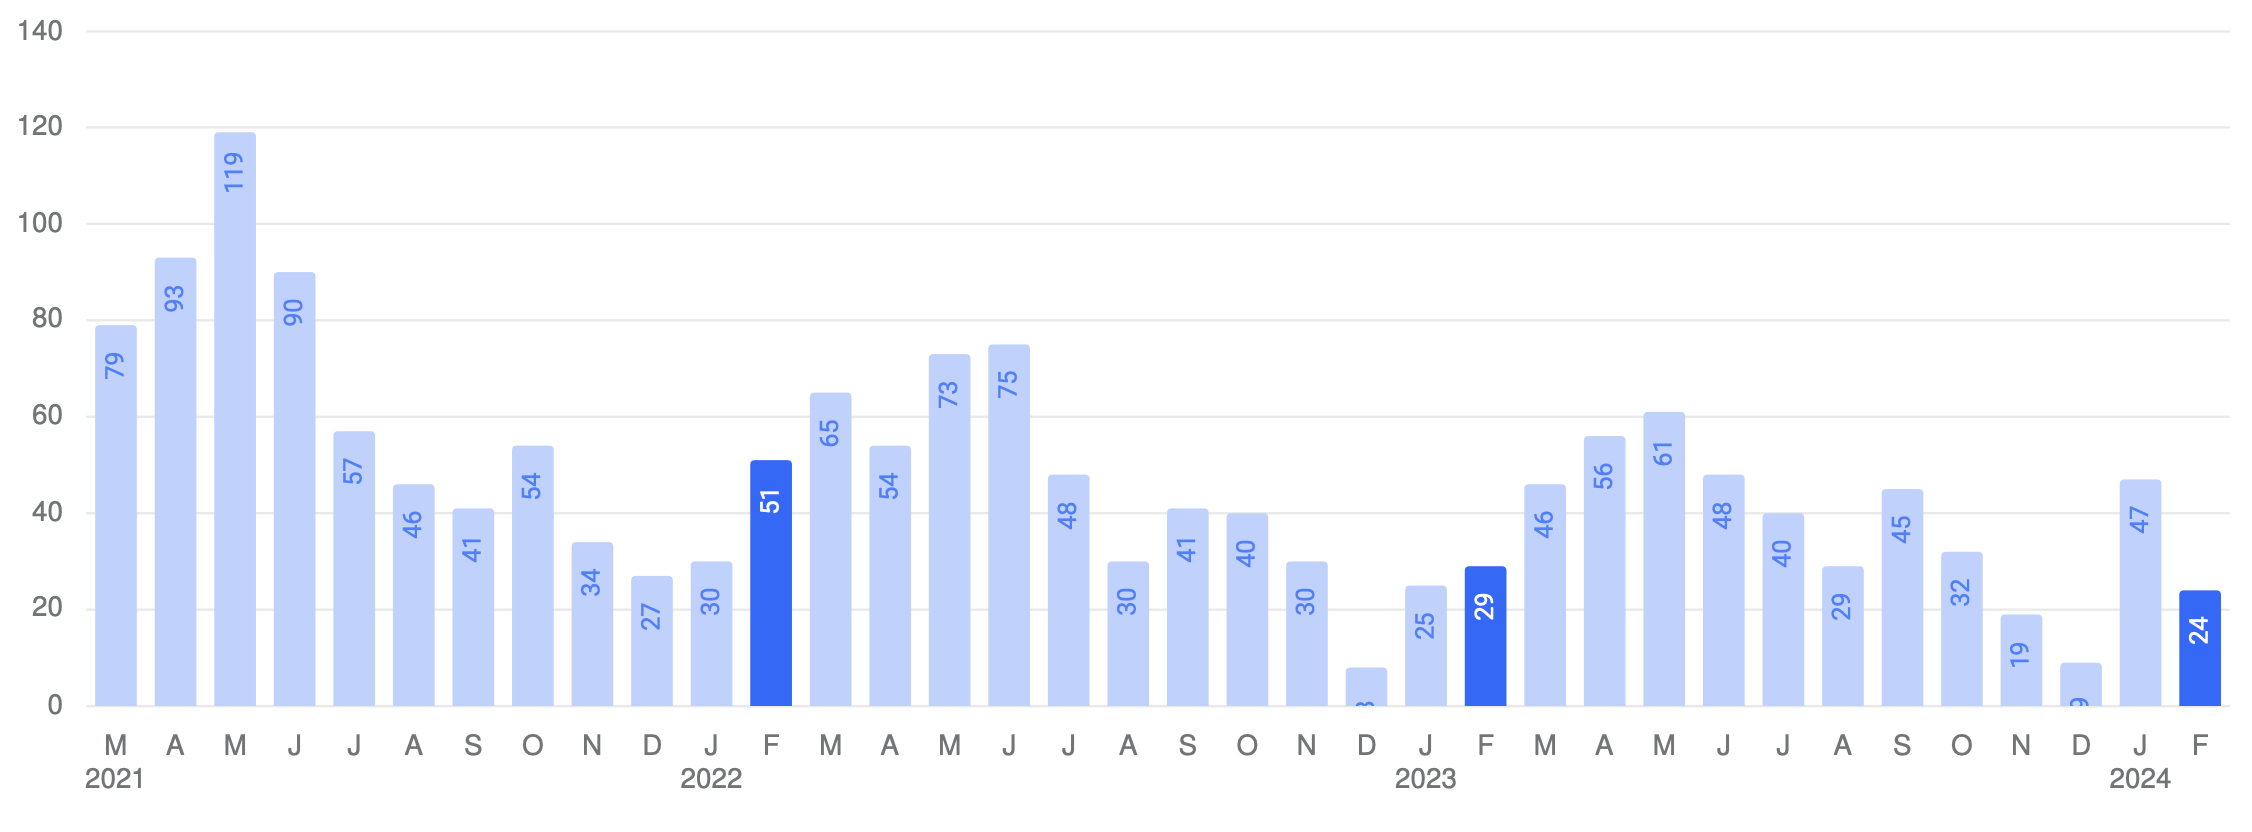
Westport, CT New Listings
MARCH, 2024
The number of new listings in February 2024 was 24, down -48.94% from 47 from the previous month and -17.24% lower than 29 from February 2023. The February 2024 listings were at its lowest level compared to February 2023 and 2022.
© 2024 Coldwell Banker. All Rights Reserved. Coldwell Banker and the Coldwell Banker logos are trademarks of Coldwell Banker Real Estate LLC. The Coldwell Banker® System is comprised of company owned offices which are owned by a subsidiary of Realogy Brokerage Group LLC and franchised offices which are independently owned and operated. The Coldwell Banker System fully supports the principles of the Fair Housing Act and the Equal Opportunity Act.

Based on information from SmartMLS for the period 3/1/2021 through 2/29/2024. Source data is deemed reliable but not guaranteed. Real estate agents affiliated with Coldwell Banker Realty are independent contractor sales associates, not employees.