CITY: WESTPORT, CT
BY: JUDY MICHAELIS, 203-247-5000
Westport, CT Real Estate Market Update, January 2023
Hi Westport, CT homeowners! I’m here with the January 2023 Westport real estate market update. In 2023, our Westport real estate market has started unbelievably strong. I would dare say that I think the market is stronger this year than last year. For example, we had a home for sale listed on the market last year; in 2021 and 2022, this home was listed for sale at $3,200,000. In January, the home was listed for sale at $3,800,000 and it sold within a week – only four days! We have record low inventory of homes for sale, even lower than January 2022!
Sitting down with a top realtor is vital in helping you understand your options. If you’d like to know what’s going on in your part of the Westport, CT real estate market or you’re looking for any further detailed analysis, feel free to call, text, or email me – I’d love to hear from you. If you like what you see and hear in my videos, just subscribe above!
– Judy
203-247-5000
judy@judymichaelis.com
Westport, CT Real Estate Market & Trends Overview
JANUARY, 2023
Westport, CT Properties Sold and Absorption Rate
JANUARY, 2023
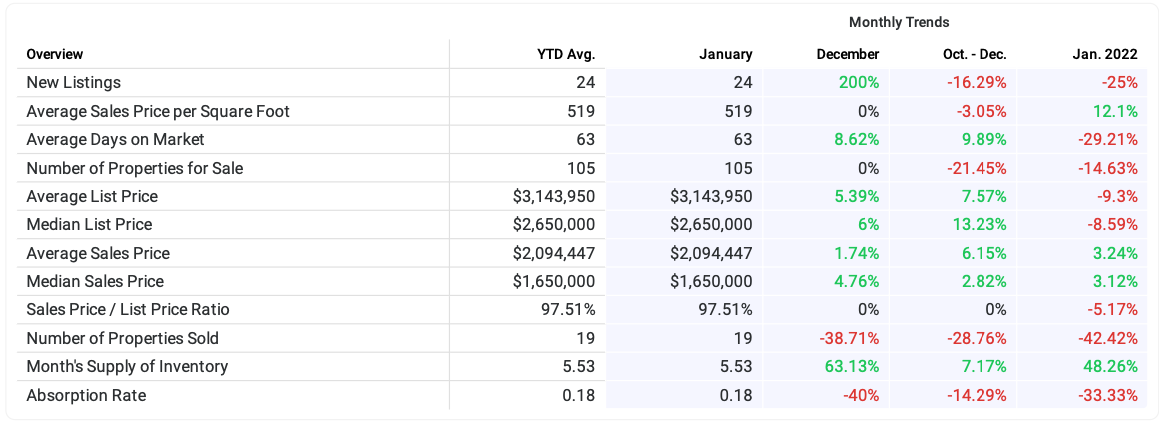
The number of properties sold in January 2023 was 19, down -38.71% from 31 from the previous month and -42.42% lower than 33 from January 2022. The January 2023 sales were at its lowest level compared to January 2022 and 2021. Absorption rate is the average number of sales per month divided by the total number of available properties.

Westport, CT Average and Median Home Sales Prices
JANUARY, 2023
The median sales price in January 2023 was $1,650,000, up 4.76% from $1,575,000 from the previous month and 3.12% higher than $1,600,000 from January 2022. The January 2023 median sales price was at its highest level compared to January 2022 and 2021. The average sales price in January 2023 was $2,094,447, up 1.74% from $2,058,529 from the previous month and 3.24% higher than $2,028,639 from January 2022. The January 2023 average sale price was at its highest level compared to January 2022 and 2021.

Westport, CT Inventory & MSI
JANUARY, 2023
The total inventory of properties for sale in January 2023 was 105, equal to the previous month and -14.63% lower than 123 from January 2022. The January 2023 inventory was at its lowest level compared with January 2022 and 2021. A comparatively lower MSI is more beneficial for sellers while a higher MSI is better for buyers. The January 2023 MSI of 5.53 months was at its highest level compared with January 2022 and 2021.

Westport, CT Average Days on Market (DOM)
JANUARY, 2023
The average days on market (DOM) is the number of days a property is on the market before it sells. An upward trend in DOM tends to indicate a move towards a buyer’s market, a downward trend tends to indicate a move towards seller’s market. The DOM for January 2023 was 63 days, up 8.62% from 58 days from the previous month and -29.21% lower than 89 days from January 2022. The January 2023 DOM was at its lowest level compared with January 2022 and 2021.

Westport, CT Average Sales Price per Square Foot
JANUARY, 2023
The average sales price per square foot is a more normalized indicator for the direction of property value. Since Median Sales Price and Average Sales price can be impacted by the ‘mix’ of high or low end Properties in the real estate market, the selling price per square foot is a more normalized indicator on the direction of Property values. The sales price per square foot in January 2023 was $519, equal to the previous month and 12.10% higher than $463 from January 2022.

Westport, CT Sales Price / List Price Ratio
JANUARY, 2023
The sales price/list price ratio is the average sale price divided by the average list price for sold properties expressed as a percentage. If it is above 100%, homes are selling for more than the list price. If it is less than 100%, homes are selling for less than the list price. The January 2023 sales price/list price ratio was 97.51%, equal to the previous month and down from 102.83% from January 2022.

Westport, CT New Listings
JANUARY, 2023
The number of new listings in January 2023 was 24, up 200% from 8 from the previous month and -25.00% lower than 32 from January 2022. The January 2023 listings were at its lowest level compared to January 2022 and 2021.

© 2023 Coldwell Banker. All Rights Reserved. Coldwell Banker and the Coldwell Banker logos are trademarks of Coldwell Banker Real Estate LLC. The Coldwell Banker® System is comprised of company owned offices which are owned by a subsidiary of Realogy Brokerage Group LLC and franchised offices which are independently owned and operated. The Coldwell Banker System fully supports the principles of the Fair Housing Act and the Equal Opportunity Act.

Based on information from SmartMLS for the period 2/1/2020 through 2/1/2023. Due to MLS reporting methods and allowable reporting policy, this data is only informational and may not be completely accurate. Therefore, Coldwell Banker Residential Brokerage does not guarantee the data accuracy. Data maintained by the MLS’s may not reflect all real estate activity in the market.