CITY: WESTPORT, CT
BY: JUDY MICHAELIS, 203-247-5000
Westport homeowners: Our August real estate market figures are in: just as they’ve been all throughout 2023, Westport homes for sale and inventory are down about 30%. The big question everybody is speculating on is which way the Westport market is going: will it soften? It really depends on Westport commuter habits. Are commuters traveling to their New York City offices five days per week, or three? If all remains the same at roughly three days per week, then the market will follow. But if NYC office workers begin commuting to the office five days per week, our market will soften.
Sitting down with a top realtor is vital in helping you understand your options. If you’d like to know what’s going on in your part of Westport, or you’re looking for any further detailed analysis, feel free to call, text, or email me – I’d love to have a personal conversation with you. If you like what you see and hear in my videos, just subscribe above!
– Judy
Westport, CT Real Estate Market & Trends Overview
AUGUST, 2023

Westport, CT Average and Median Home Sales Prices
AUGUST, 2023
The median sales price in August 2023 was $2,300,000, up 12.61% from $2,042,500 from the previous month and 21.05% higher than $1,900,000 from August 2022. The August 2023 median sales price was at its highest level compared to August 2022 and 2021. The average sales price in August 2023 was $2,469,216, up 6.58% from $2,316,880 from the previous month and 10.12% higher than $2,242,352 from August 2022. The August 2023 average sale price was at its highest level compared to August 2022 and 2021.

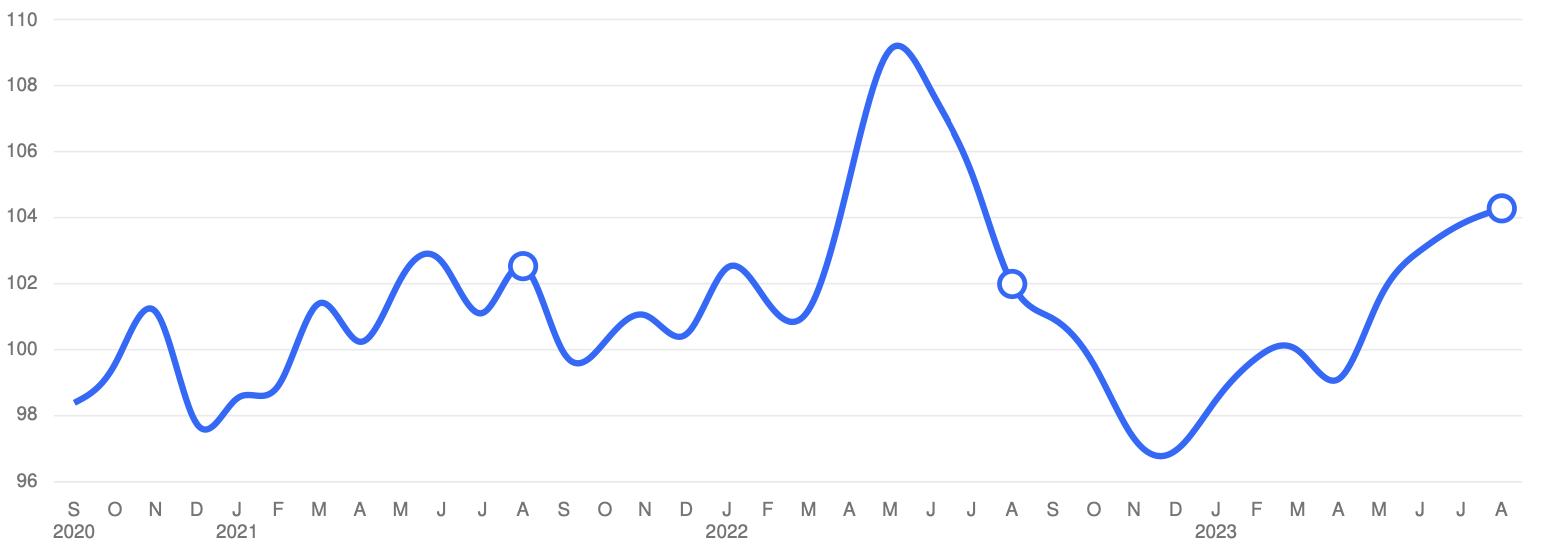
Westport, CT Sales Price / List Price Ratio
AUGUST, 2023
The sales price/list price ratio is the average sale price divided by the average list price for sold properties expressed as a percentage. If it is above 100%, homes are selling for more than the list price. If it is less than 100%, homes are selling for less than the list price.The August 2023 sales price/list price ratio was 104.28%, equal to the previous month and up from 101.99% from August 2022.
Westport, CT Number of Properties Sold and Absorption Rate
AUGUST, 2023
The number of properties sold in August 2023 was 39, down -26.42% from 53 from the previous month and -22.00% lower than 50 from August 2022. The August 2023 sales were at its lowest level compared to August 2022 and 2021. Absorption rate is the avg number of sales per month divided by the total number of available properties.

Westport, CT Average Days on Market (DOM)
AUGUST, 2023
The average days on market (DOM) is the number of days a property is on the market before it sells. An upward trend in DOM tends to indicate a move towards a buyer’s market, a downward trend tends to indicate a move towards seller’s market. The DOM for August 2023 was 43 days, down -29.51% from 61 days from the previous month and -21.82% lower than 55 days from August 2022. The August 2023 DOM was at its lowest level compared with August 2022 and 2021.

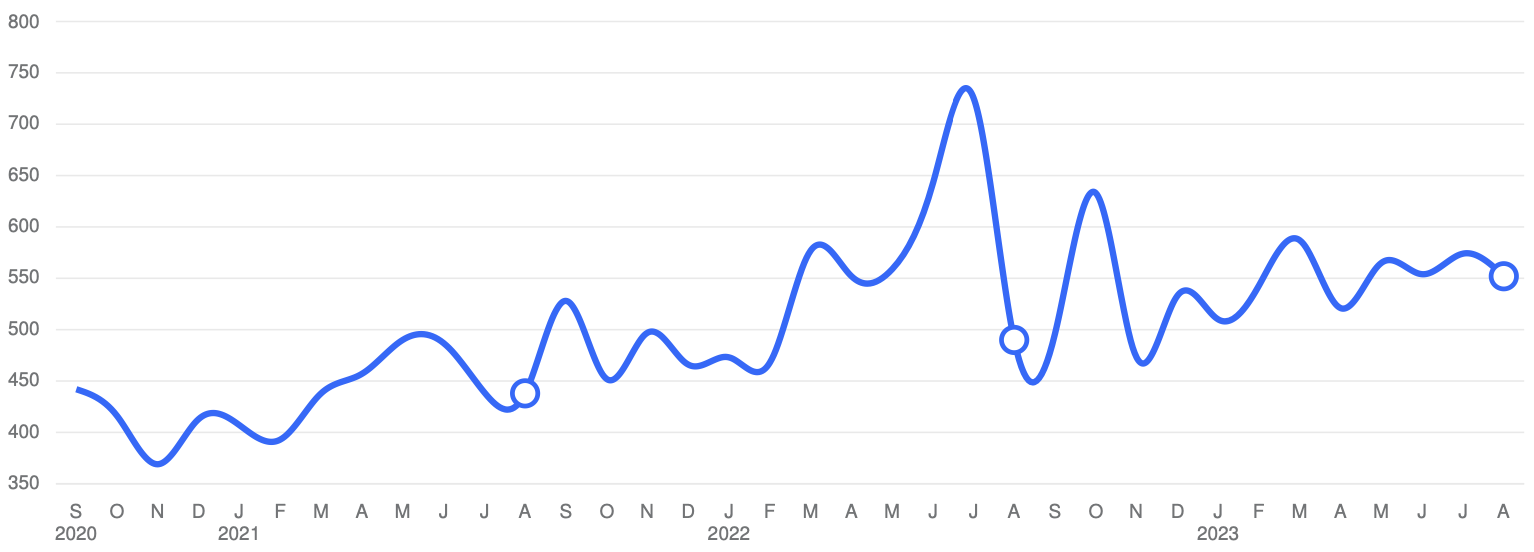
Westport, CT Average Sales Price per Square Foot
AUGUST, 2023
The average sales price per square foot is a more normalized indicator for the direction of property value. Since Median Sales Price and Average Sales price can be impacted by the ‘mix’ of high or low end Properties in the real estate market, the selling price per square foot is a more normalized indicator for the direction of property value. The sales price per square foot in August 2023 was $552, down -3.83% from $574 from the previous month and 12.65% higher than $490 from August 2022.
Westport, CT Inventory & MSI
AUGUST, 2023
The number of properties for sale in August 2023 was 76, down -26.21% from 103 from the previous month and -31.53% lower than 111 from August 2022. The August 2023 inventory was at its lowest level compared with August 2022 and 2021. A comparatively lower MSI is more beneficial for sellers while a higher MSI is better for buyers. The August 2023 MSI of 1.95 months was at its lowest level compared with August 2022 and 2021.

Westport, CT New Listings
AUGUST, 2023
The number of new listings in August 2023 was 27, down -32.50% from 40 from the previous month and -10.0% lower than 30 from August 2022. The August 2023 listings were at its lowest level compared to August 2022 and 2021.

© 2023 Coldwell Banker. All Rights Reserved. Coldwell Banker and the Coldwell Banker logos are trademarks of Coldwell Banker Real Estate LLC. The Coldwell Banker® System is comprised of company owned offices which are owned by a subsidiary of Realogy Brokerage Group LLC and franchised offices which are independently owned and operated. The Coldwell Banker System fully supports the principles of the Fair Housing Act and the Equal Opportunity Act.

Based on information from SmartMLS for the period 9/1/2020 through 8/1/2023. Due to MLS reporting methods and allowable reporting policy, this data is only informational and may not be completely accurate. Therefore, Coldwell Banker Residential Brokerage does not guarantee the data accuracy. Data maintained by the MLS’s may not reflect all real estate activity in the market.