Westport, CT April 2024 Real Estate Market Update
City: Westport, CT
Assembled by: Judy Michaelis, 203-247-5000
Westport homeowners,
Year to date, Only had 71 sales in total. To put it in perspective, there are more than 10,000 homes in Westport. Westport is experiencing critically low inventory, only 2.6 months supply, which is down – 13% year over year. What’s more, so long as residents continue to leave the city in droves. The inventory shortage is likely to continue. That being said, if interest rates indeed come down, it’s safe to expect that more home sellers will opt to list their homes for sale. Whether trading up or downsizing, also there will be more buyers. Given these market dynamics, today is an ideal time to sell your home. There’s more to the story, Westport’s median sales price is $1,850,000 which is up 13% from 2023. The all-cash trend also continues with over 46% of Westport home sales being all cash. 🤔 If you’ve had any thoughts of selling your home, I’d love to chat with you and plan out your strategy that gets you the most amount of money the market will bear. If not, share this video with someone who may have had thoughts of selling.
Have a look at the numbers below, and let me know what you think!
Sitting down with a top realtor is vital in helping you understand your options. If you’d like to know what’s going on in your part of Westport, or you’re looking for any further detailed analysis, feel free to call, text, or email me – I’d love to have a personal conversation with you. If you like what you see and hear in my videos, just subscribe above!
– Judy
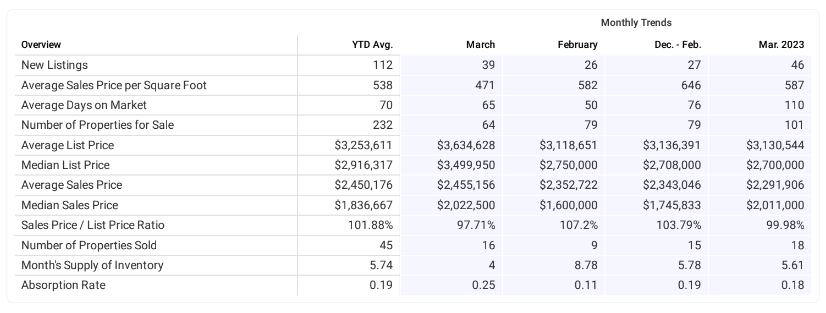
Westport, CT Real Estate Market & Trends Overview
April, 2024
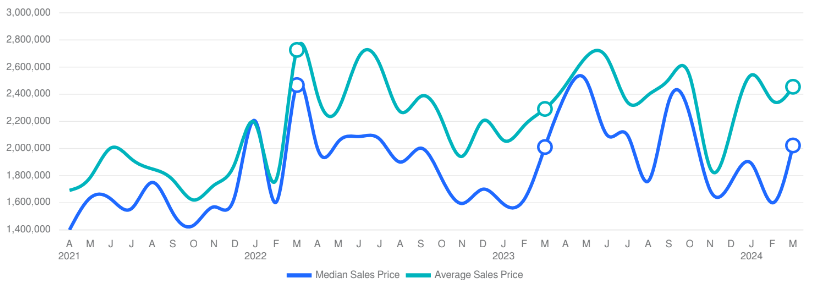
Westport, CT Average and Median Home Sales Prices
April, 2024
The median sales price in March 2024 was $2,022,500, up 26.41% from $1,600,000 from the previous month and equal to March 2023. The March 2024 median sales price was at a mid level compared to March 2023 and 2022. The average sales price in March 2024 was $2,455,156, up 4.35% from $2,352,722 from the previous month and 7.12% higher than $2,291,906 from March 2023. The March 2024 average sale price was at a mid level compared to March 2023 and 2022.
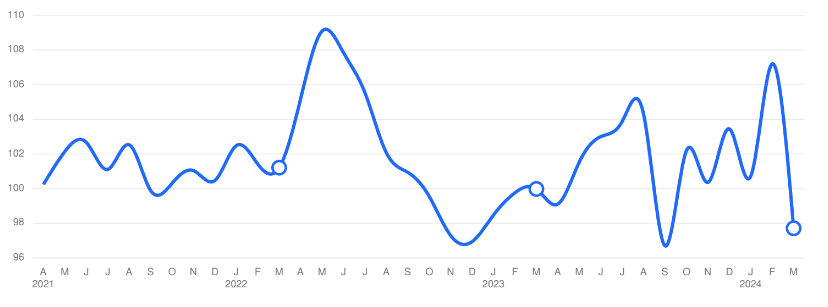
Westport, CT Sales Price / List Price Ratio
April, 2024
The sales price/list price ratio is the average sale price divided by the average list price for sold properties expressed as a percentage. If it is above 100%, homes are selling for more than the list price. If it is less than 100%, homes are selling for less than the list price. The March 2024 sales price/list price ratio was 97.71%, down from 107.2% from the previous month and down from 99.98% from March 2023.
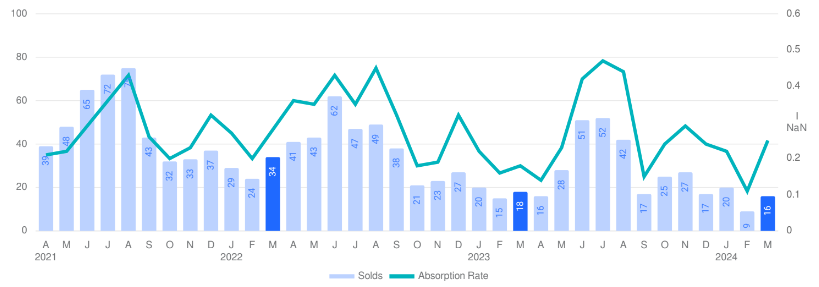
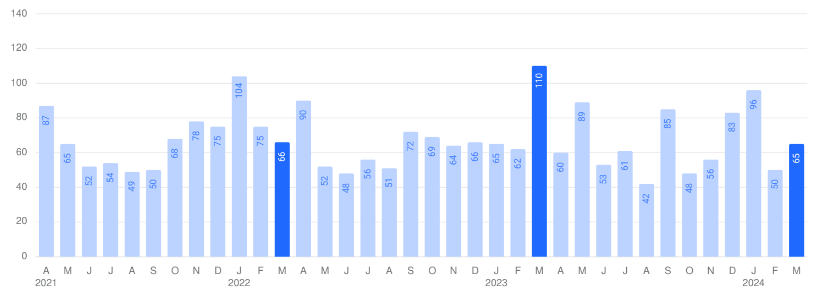
Westport, CT Number of Properties Sold and Absorption Rate
April, 2024
The number of properties sold in March 2024 was 16, up 77.78% from 9 from the previous month and -11.11% lower than 18 from March 2023. The March 2024 sales were at its lowest level compared to March 2023 and 2022. Absorption rate is the avg. number of sales per month divided by the total number of available properties.
Westport, CT Average Days on Market (DOM)
April, 2024
The average days on market (DOM) is the number of days a property is on the market before it sells. An upward trend in DOM tends to indicate a move towards a buyer’s market, a downward trend tends to indicate a move towards seller’s market. The DOM for March 2024 was 65 days, up 30.0% from 50 days from the previous month and -40.91% lower than 110 days from March 2023. The March 2024 DOM was at its lowest level compared with March 2023 and 2022.
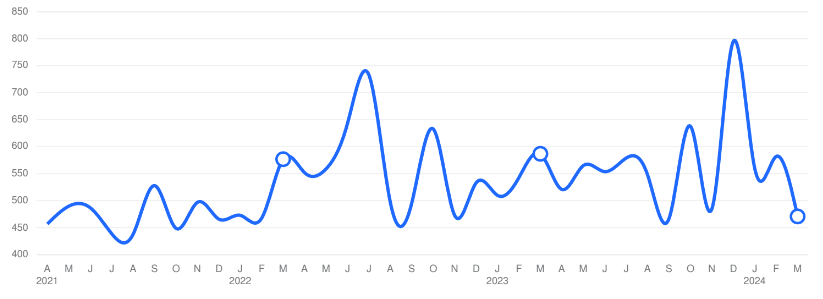
Westport, CT Average Sales Price per Square Foot
April, 2024
The average sales price per square foot is a more normalized indicator for the direction of property value. The sales price per square foot in March 2024 was $471, down -19.07% from $582 from the previous month and -19.76% lower than $587 from March 2023.
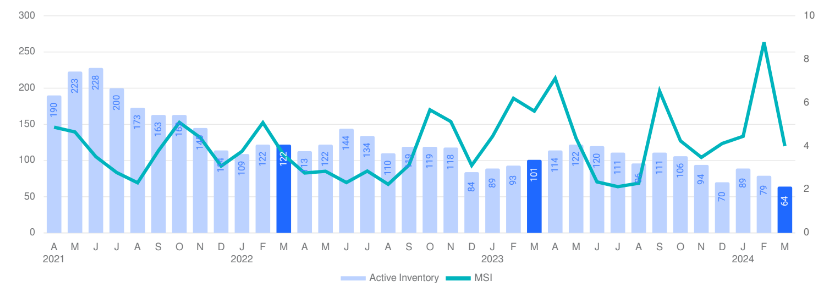
Westport, CT Inventory & MSI
April, 2024
The number of properties for sale in March 2024 was 64, down -18.99% from 79 from the previous month and -36.63% lower than 101 from March 2023. The March 2024 inventory was at its lowest level compared with March 2023 and 2022. A comparatively lower MSI is more beneficial for sellers while a higher MSI is better for buyers. The March 2024 MSI of 4 months was at a mid level compared with March 2023 and 2022.
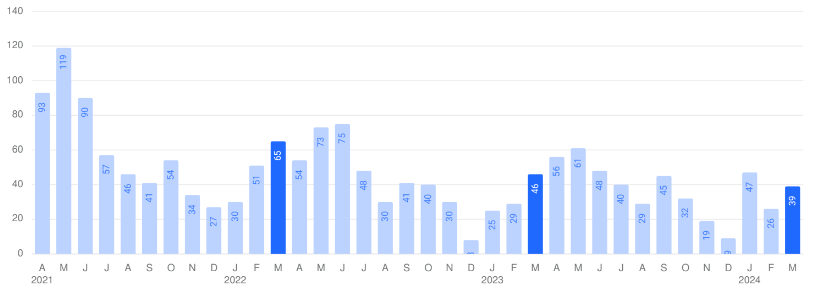
Westport, CT New Listings
April, 2024
The number of new listings in March 2024 was 39, up 50.0% from 26 from the previous month and -15.22% lower than 46 from March 2023. The March 2024 listings were at its lowest level compared to March 2023 and 2022.
© 2024 Coldwell Banker. All Rights Reserved. Coldwell Banker and the Coldwell Banker logos are trademarks of Coldwell Banker Real Estate LLC. The Coldwell Banker® System is comprised of company owned offices which are owned by a subsidiary of Realogy Brokerage Group LLC and franchised offices which are independently owned and operated. The Coldwell Banker System fully supports the principles of the Fair Housing Act and the Equal Opportunity Act.

Based on information from SmartMLS for the period 04/01/2021 through 3/31/2024. Source data is deemed reliable but not guaranteed. Real estate agents affiliated with Coldwell Banker Realty are independent contractor sales associates, not employees.